" height="22.21672870003851px" id="z3WvM4hhx" transform="translate(0 7.783)" width="44.5160044463523px"/><path d="M 0 0 L 2.973 0 L 2.973 29.237 L 0 29.237 Z" fill="rgb(51, 51, 65)" height="29.23683002950565px" id="JHCCz3Moo" transform="translate(52.332 0)" width="2.9732091795568465px"/><path d="M 0 0 L 18.335 0 L 18.335 2.973 L 0 2.973 Z" fill="rgb(88, 93, 247)" height="2.9732091795568505px" id="TtL1Ujsfx" transform="translate(26.217 3.072)" width="18.334926489198978px"/><path d="M 0 1.817 C 0 0.813 0.813 0 1.817 0 C 2.82 0 3.634 0.813 3.634 1.817 C 3.634 2.82 2.82 3.634 1.817 3.634 C 0.813 3.634 0 2.82 0 1.817 Z" fill="rgb(88, 93, 247)" height="3.633967846768943px" id="E_sZ1ZJZP" transform="translate(57.862 26.217)" width="3.6339678467688827px"/></g></svg>)
Forecasting Without the Fear: From Dashboards to AI Assistants
Fashion doesn’t need more spreadsheets or empty AI hype, it needs tools that handle uncertainty, show trade-offs clearly, and adapt to human decisions.

Nūl Content Team
Senior Data Scientist
I’m a Senior Data Scientist at Nūl, where I use over a decade of experience in analytics and modeling to make fashion retail more predictable and less wasteful. My background spans telecom, digital products, and revenue innovation, but today my focus is on helping retailers forecast demand, plan inventory, and cut down on waste. I enjoy turning complexity into clarity — building models and forecasts that teams can actually trust and act on. At Nūl, my projects range from detailed forecasting to product lifecycle insights, all aimed at helping brands make smarter, more sustainable decisions.

Table of contents
When I joined Nūl a few months ago, I’ll admit - I had zero background in fashion. My experience was in building ML models, optimizing workflows, and scaling analytics systems in telecom, digital products, and new revenue streams. Fashion felt like a different universe: fabrics, SKUs, production cycles, seasons.
But very quickly I realized something familiar: the spreadsheet struggle. Fashion teams, just like the ones I’d seen elsewhere, were drowning in manual formulas, debating if the numbers “looked realistic”, and spending late nights tweaking assumptions. Dashboards have helped a little, but most people don’t live in dashboards.
The real question they were asking wasn’t “what does the curve look like?” but something much simpler: “How much stock is safe to order this week?”
>> Read more: Top 14 Demand Forecasting Methods in Fashion Supply Chain
What I Learned: Forecasting isn’t About a Single Number
Coming from outside the industry gave me perspective. In every sector I’ve worked in, the same truth holds: demand is never a single number. It’s always a range.
Fashion teams face the classic dilemma: play it safe with steady stock, or go bold for the campaign and hope demand follows? That’s why at Nūl, we lean on Monte Carlo simulations.
It’s not magic—it’s math. Thousands of “what if” scenarios condensed into usable planning ranges like P50, P85, and P95:
P50 → balanced forecast. Lean, but higher risk of stockouts.
P85 → safer buffer. Fewer stockouts, slightly higher holding.
P95 → ultra-safe. Almost no stockouts, but heavier inventory.
These aren’t confidence intervals—they’re decision scenarios. And leaders can pick the point that matches their appetite for risk.
Why the Math isn’t the Point?
As someone who’s spent years building statistical models, this surprised me: the real value isn’t the complexity of the math. It’s how clearly the math reveals trade-offs.
Take a simple SKU: a black T-shirt, size M, over 3 weeks.
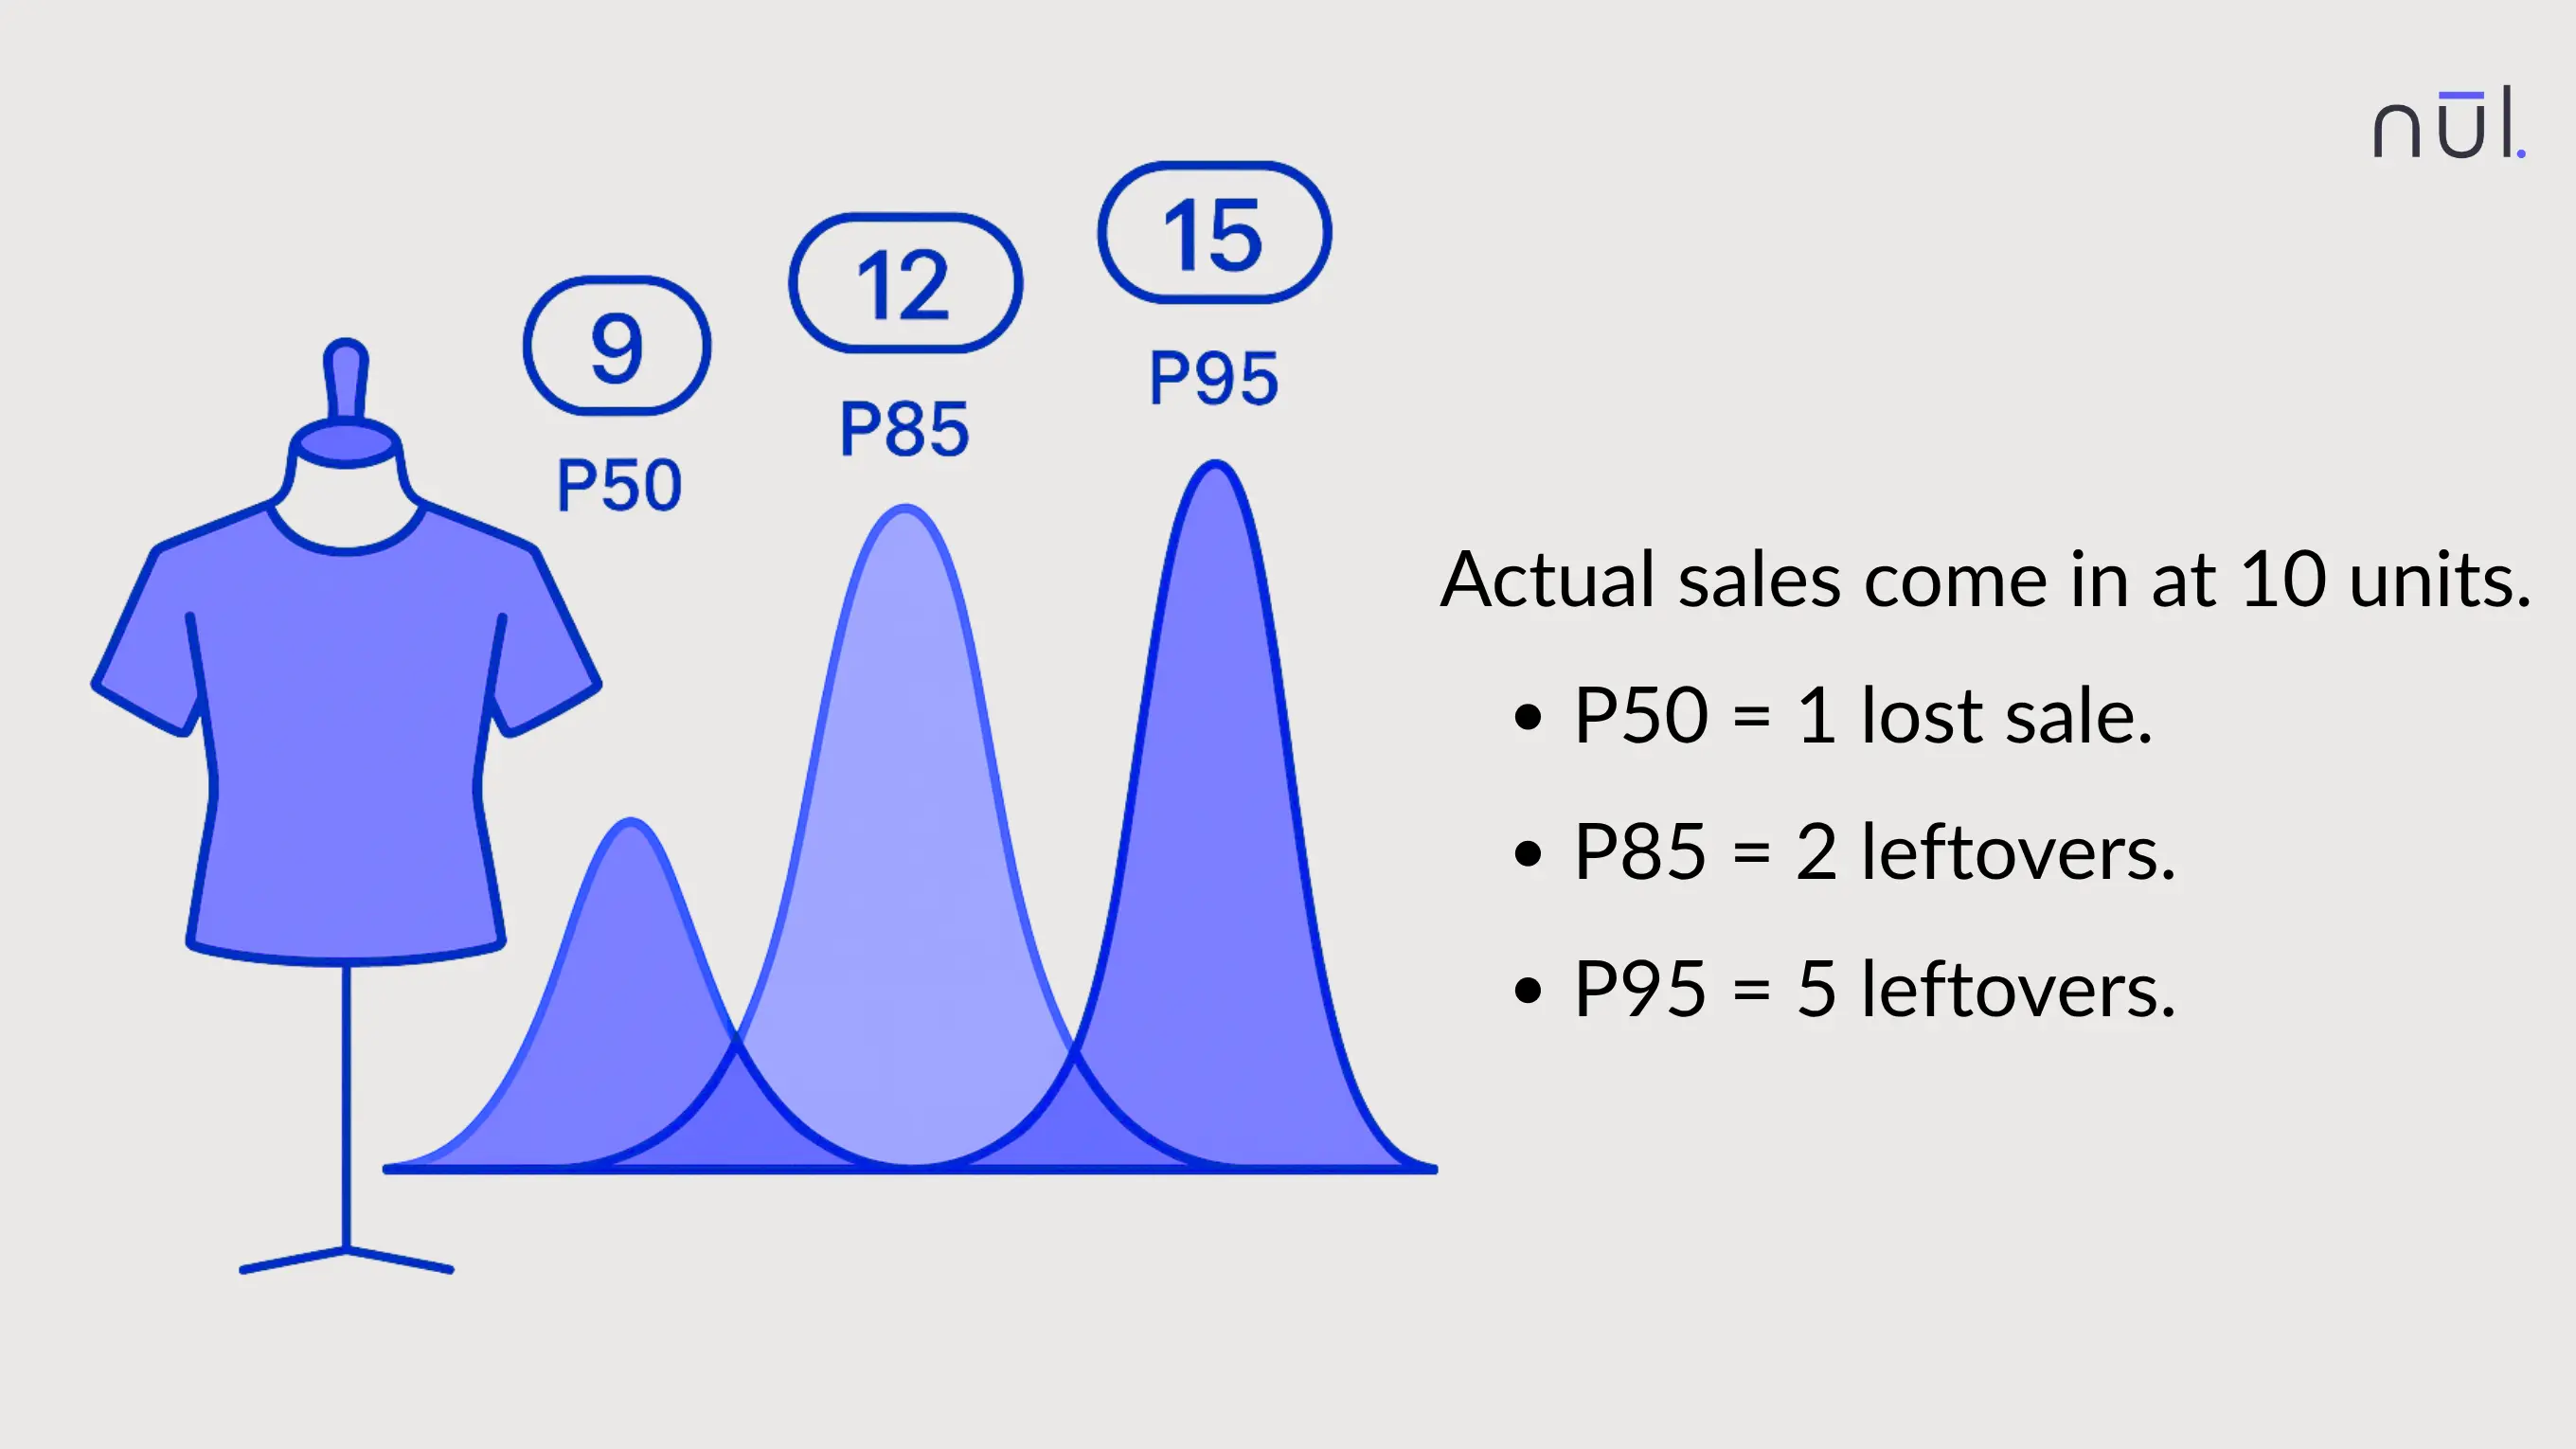
P50 → 9 units.
P85 → 12 units.
P95 → 15 units.
Actual sales come in at 10 units.
P50 = 1 lost sale.
P85 = 2 leftovers.
P95 = 5 leftovers.
The takeaway isn’t “Monte Carlo is cool.” It’s that you can see the outcomes of different choices before making them. That’s what reduces fear.
Why the Math isn’t the Point?
Dashboards and AI aren’t Competitors - They’re Complements
I’ve noticed that different roles see forecasting differently:
Owners want transparency: charts, KPIs, probability curves.
Ops managers want direct answers: “Order 600 units at P85.”
Store teams want clarity: numbers they can act on today.
That’s why I don’t think AI is here to “replace dashboards.” Instead, it bridges the gap. Dashboards show the what; AI assistants guide the what to do next.
The Adoption Challenge: Lowering the Barrier to Trust
Here’s one lesson I carried over from past industries: the best model in the world is useless if people don’t adopt it.
If the system feels like a black box, it won’t be trusted. If it demands a steep learning curve, it won’t be used. That’s why we design forecasting intelligence at Nūl to be:
Familiar → translating risk buffers into P50/P85/P95 scenarios.
Transparent → surfacing trade-offs, not hiding them.
Accessible → letting people ask an AI and get a clear, reliable response.

Forecasting Intelligence at Nūl
Closing Thought
I never expected to work in fashion, but what I’ve learned is that forecasting here isn’t that different from forecasting anywhere else, it’s about balancing risk, trust, and usability.
Fashion doesn’t need more spreadsheets, and it definitely doesn’t need AI hype for its own sake. What it needs are tools that respect uncertainty, present trade-offs simply, and adapt to how different people make decisions.
When teams can see the risks, trust the options, and act with confidence, waste goes down, trust goes up, and growth becomes sustainable.
And for me — that’s the real win.
Looking for more? Dive into our other articles, updates, and strategies


Let's show you how
