" height="22.21672870003851px" id="z3WvM4hhx" transform="translate(0 7.783)" width="44.5160044463523px"/><path d="M 0 0 L 2.973 0 L 2.973 29.237 L 0 29.237 Z" fill="rgb(51, 51, 65)" height="29.23683002950565px" id="JHCCz3Moo" transform="translate(52.332 0)" width="2.9732091795568465px"/><path d="M 0 0 L 18.335 0 L 18.335 2.973 L 0 2.973 Z" fill="rgb(88, 93, 247)" height="2.9732091795568505px" id="TtL1Ujsfx" transform="translate(26.217 3.072)" width="18.334926489198978px"/><path d="M 0 1.817 C 0 0.813 0.813 0 1.817 0 C 2.82 0 3.634 0.813 3.634 1.817 C 3.634 2.82 2.82 3.634 1.817 3.634 C 0.813 3.634 0 2.82 0 1.817 Z" fill="rgb(88, 93, 247)" height="3.633967846768943px" id="E_sZ1ZJZP" transform="translate(57.862 26.217)" width="3.6339678467688827px"/></g></svg>)
14 Best Demand Forecasting Methods in Fashion Supply Chain
Demand forecasting methods uses data (Quantitative: time series, regression, AI/ML, predictive models,...) or expert (Qualitative: Delphi, Sales force,...) input.

Nūl Content Team
An Experienced Research & Knowledge Team
The Nūl Content Team combines expertise in technology, fashion, and supply chain management to deliver clear, practical insights. Guided by Nūl’s mission to end overproduction, we create content that helps brands forecast demand more accurately, optimize inventory, and build sustainable operations. Every piece we publish is grounded in real-world experience, ensuring it’s both credible and actionable.

Table of contents
Demand forecasting is the process of predicting future customer demand so businesses can plan production, inventory, and purchasing with confidence. In competitive fields like fashion, accurate forecasting is the fastest way to succeed.
So, you need a suitable demand forecasting method to maintain the crucial balance between meeting demand and managing costs. Current demand forecasting methods rely either on historical data (Quantitative) or human expertise (Qualitative) to estimate future demand. Besides, there are more advanced options like Machine Learning to help detect fast-changing trends.
Different forecasting methods exist because businesses have different levels of data maturity, demand patterns, and planning horizons. This guide breaks down every major demand forecasting method, with simple explanations tailored to help supply chain teams select the right tool for every product.
>> Read more: Top 7 AI-Powered Demand Forecasting Tools for Fashion
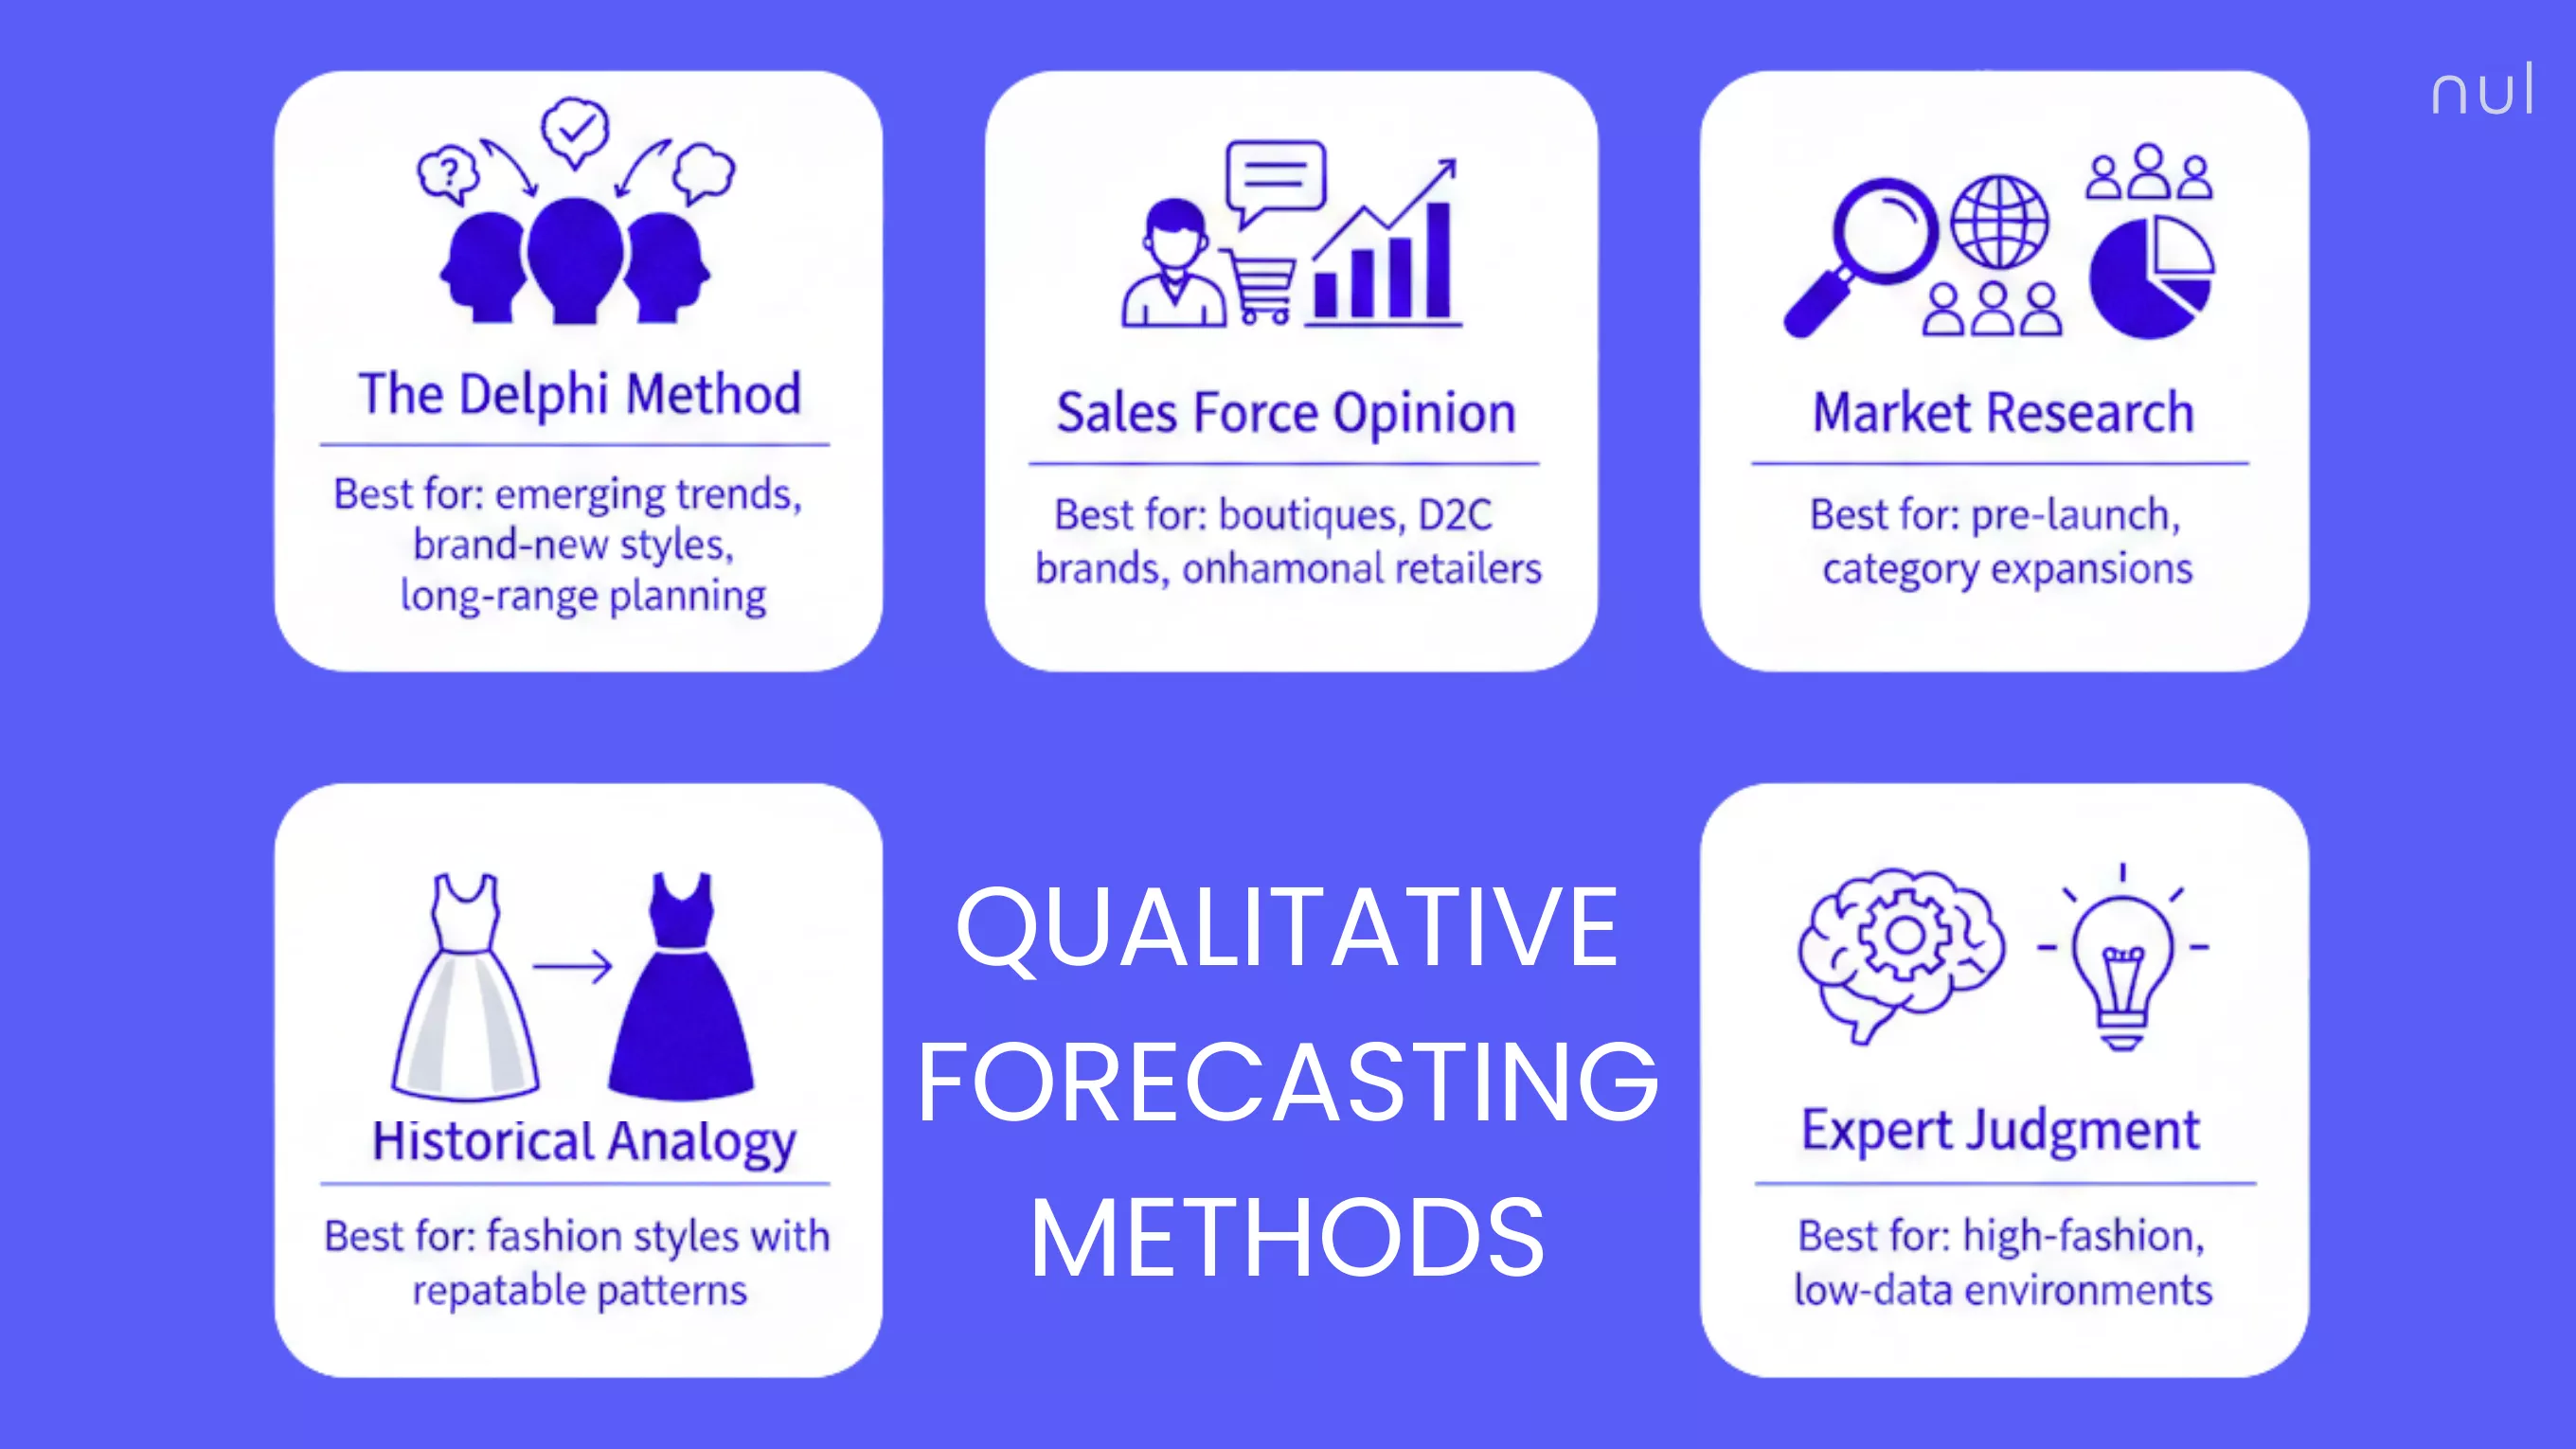
Qualitative Forecasting Methods
Qualitative methods are used when historical data is limited or unreliable and rely entirely on expert opinion, market knowledge, and intuition rather than numerical data. They are common for new collections, new categories, seasonal launches, or trend-driven designs.
The Delphi Method
A structured group technique where experts (internal or external) independently submit initial forecasts, often via multiple rounds of questionnaires. A facilitator aggregates the anonymous responses, shares the summary statistics and rationale, and asks the experts to revise their predictions in subsequent rounds. These cycles finish when a consensus forecast emerges.
Best for: Emerging trends, brand-new styles, long-range planning.
Pros: Eliminates personal bias and groupthink.
Con: Time-consuming and requires significant expert management.
Sales Force Opinion
Your retail or e-commerce teams forecast demand based on customer conversations and frontline data. Since the sales force is closest to the customer, they have unique insights into current consumer demand, promotional effectiveness, and local competitive shifts. The individual forecasts are then aggregated, or "composited," at the regional or national level.
Best for: Boutiques, D2C brands, omnichannel retailers.
Pros: Highly informed by direct customer feedback.
Cons: Individual forecasts can be overly optimistic (to influence inventory levels) or biased toward achieving easy sales quotas.
Market Research
Formal studies aimed at evaluating consumer interest and buying intent before a product launch. This includes consumer surveys, focus groups to observe reactions to prototypes, and analyzing competitor performance and pricing strategies.
Best for: Pre-launch forecasting, category expansions, determining optimal price points.
Pros: Provides actionable data on why consumers might buy.
Cons: Expensive, and stated buying intent in a survey often does not translate into actual purchase behavior.
Historical Analogy
Description: Forecasting demand for a new product based on the performance of a similar past product. In fashion, for example, compare a new knit sweater with last year's top-selling knit sweater that shared a similar price point, fiber, and release window.
Best for: Fashion styles with repeatable patterns.
Pros: Quick, cheap, and based on real-world data from the past.
Cons: Accuracy highly depends on how truly analogous the historical product is; fails entirely during trend shifts.
Expert Judgment
This method relies on the direct, un-vetted opinion of a single, highly experienced individual, typically a senior executive (like CMO, VP of sales, lead designer, etc.). The forecast is based on their industry knowledge, experience, and intuition. It is often used as a final adjustment to override statistical forecasts (known as forecasting enrichment) when critical, unquantifiable information is known.
Best for: High-fashion, low-data environments, small or knowledge-concentrated organizations, response to unexpected events.
Pros: Fastest method; include strategic and market knowledge that models cannot access.
Cons: Can include personal bias and lack transparency and accountability.
Qualitative Forecasting Methods
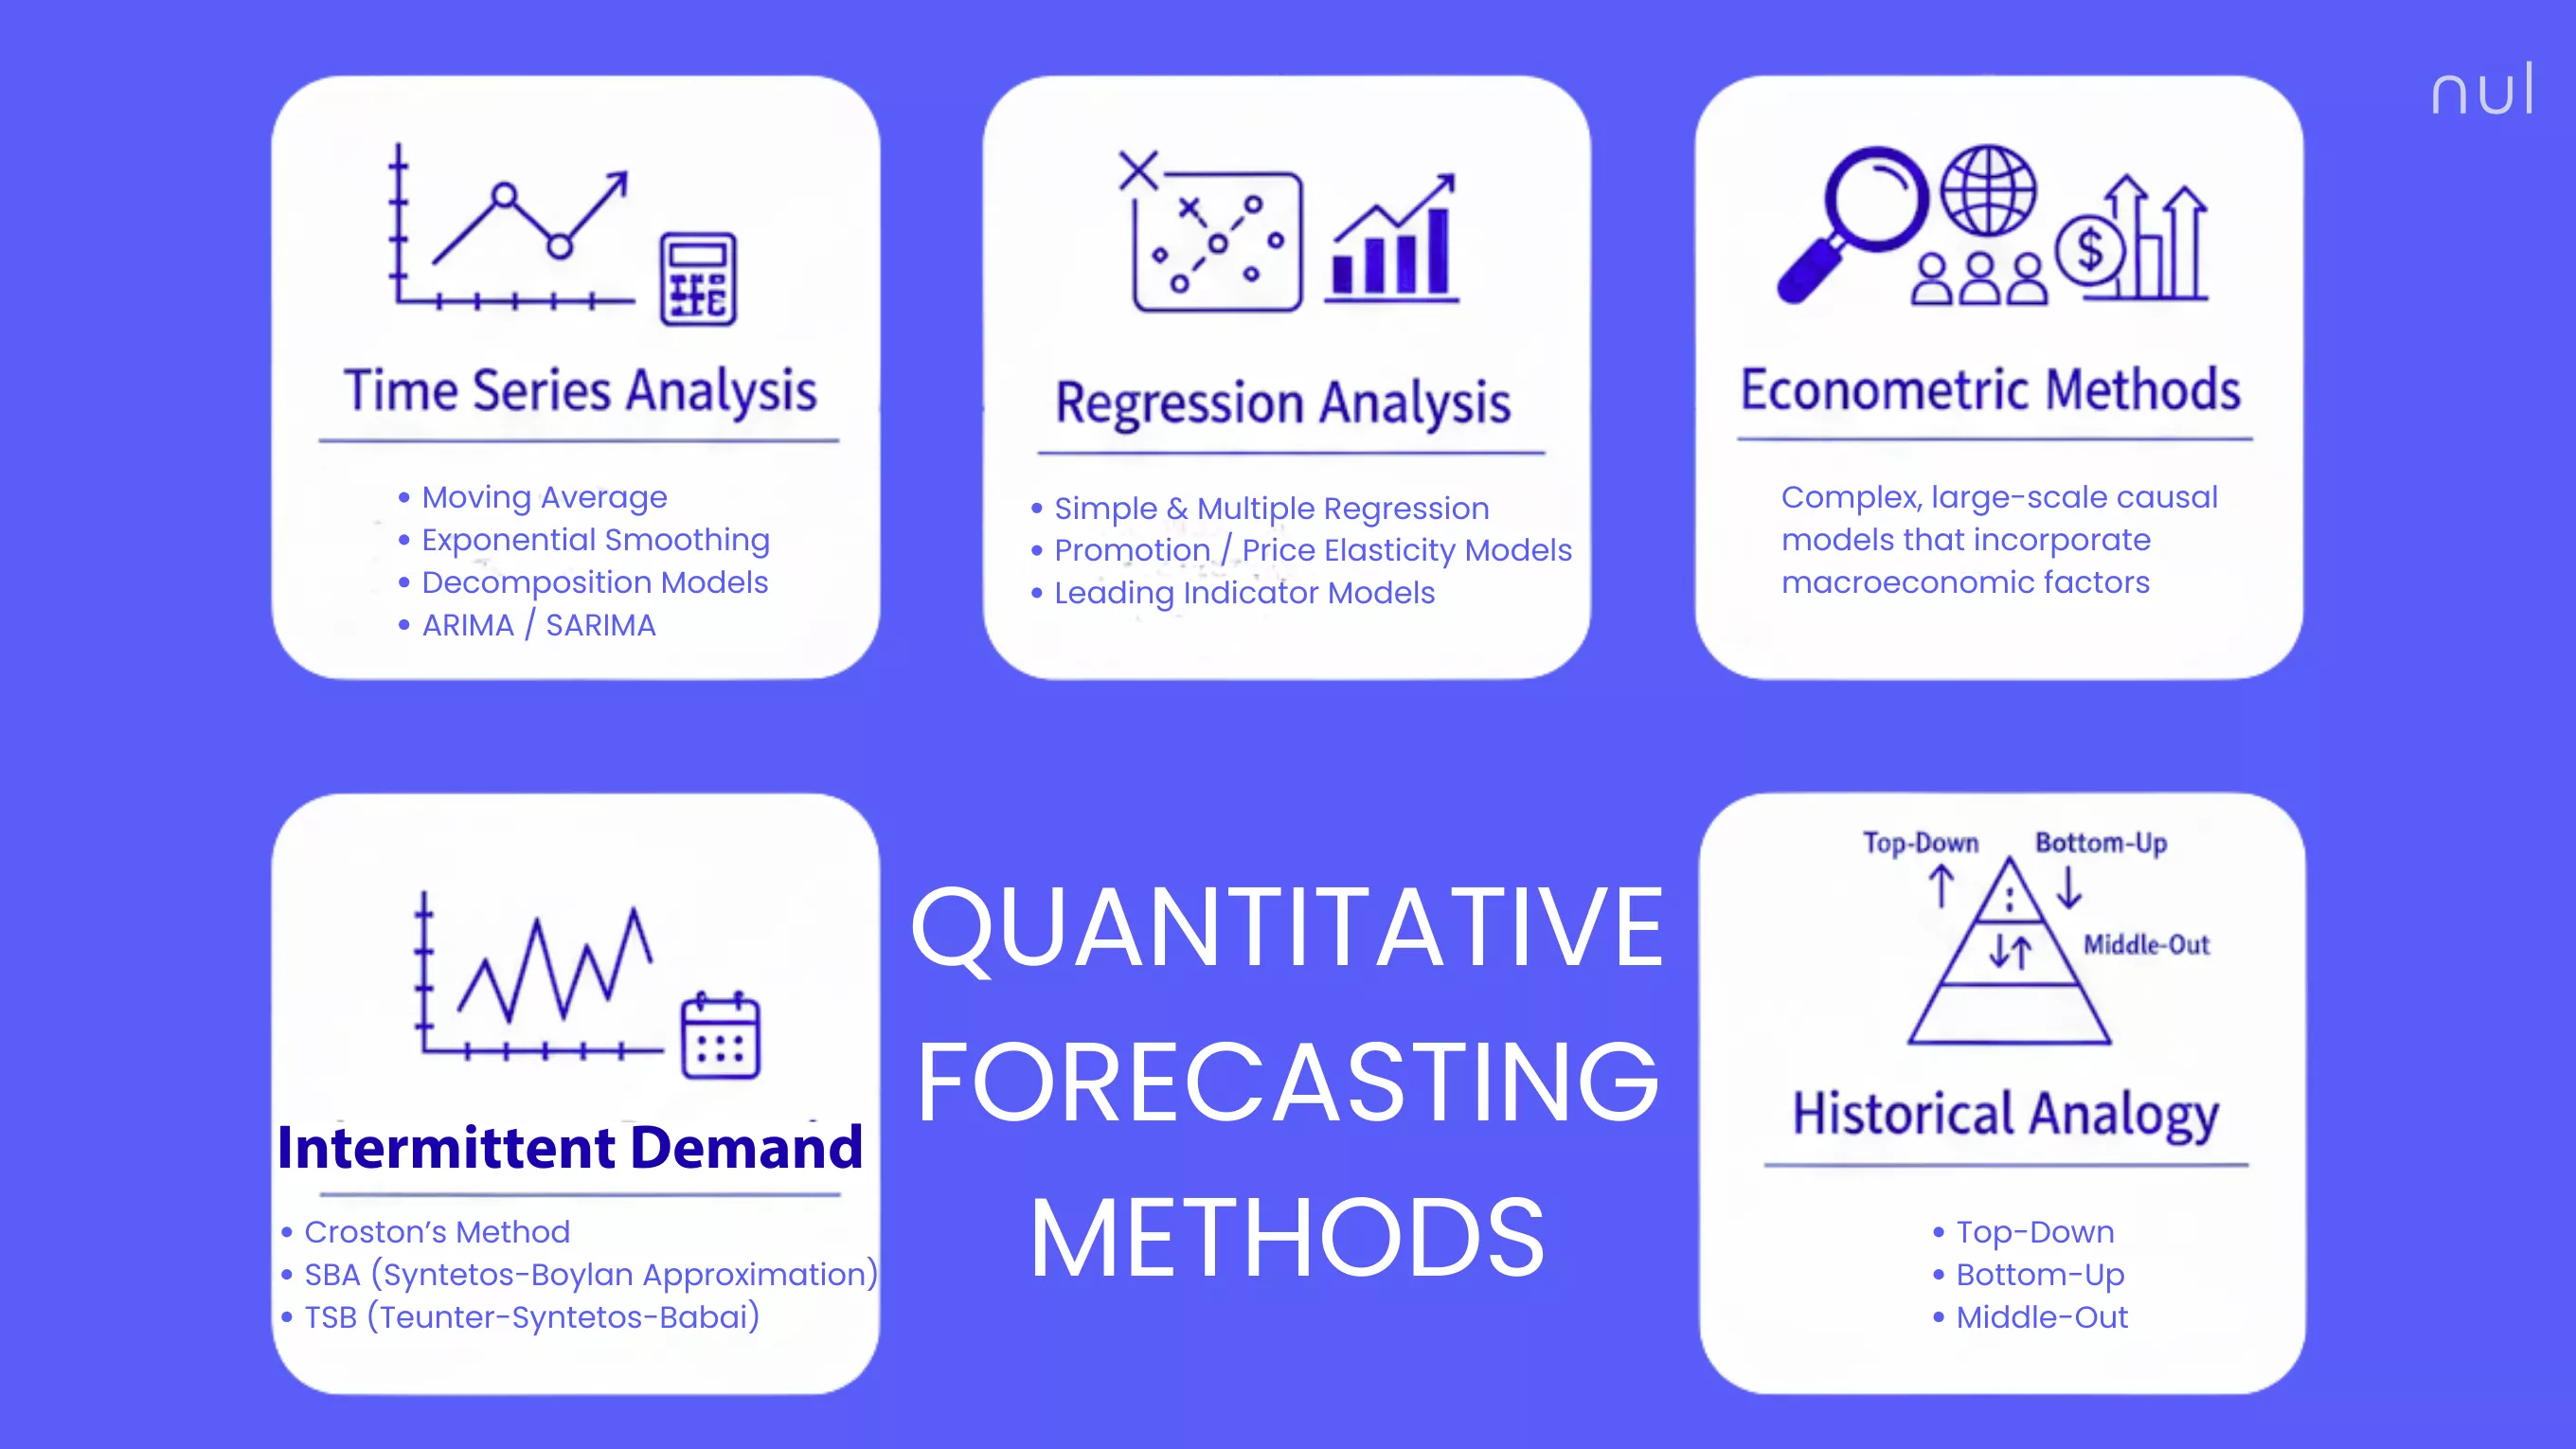
Quantitative Forecasting Methods
Quantitative methods are the data-driven core of modern demand planning. They rely on mathematical and statistical models that learn patterns and trends from historical numerical data. These methods are ideal for businesses with established products, consistent sales patterns, and predictable demand patterns.
Time Series Analysis
This method mainly analyze the product's own past sales data to to predict future demand. They identify patterns like trend (long-term growth/decline), seasonality (regular peaks/troughs), and cycles (longer, non-regular swings).
Here are some techniques:
Technique | Description | Best for |
|---|---|---|
Moving Average (MA) | A foundational technique that smooths out random fluctuations (noise) in demand by calculating the average sales over a specified number of recent periods (e.g., a 4-week average). | Stable, steady-selling SKUs. |
Exponential Smoothing (ES) | A more reactive and sophisticated method than MA, giving more weight to recent data than than older ones. This family includes:
| Apparel with predictable seasonal peaks (e.g., summer swimsuits, holiday collections). |
Decomposition Models | Break down the historical demand signal into components (Trend, Seasonality, and Remainder/Randomness). Each component is forecasted separately, and the parts are recombined to form the final forecast. | Understanding the distinct drivers of demand volatility, seasonal budgeting. |
ARIMA / SARIMA | AutoRegressive Integrated Moving Average (and Seasonal ARIMA) are advanced statistical models used when a time series shows autocorrelation (past values influencing future values). | Brands with several years of clean sales data. |
Pros: Require low data input.
Cons: Ignore external drivers (price, promotions, competitors).
Regression Analysis
Unlike Time Series, these methods predict demand by modeling the relationship between sales (dependent variable) and one or more external influencing factors (independent variables).
Techniques of this method:
Technique | Description | Best for |
|---|---|---|
Simple & Multiple Regression | Predict demand based on a linear relationship with one (Simple) or multiple (Multiple) drivers, such as average price, advertising spend, or local weather conditions. | Identify key performance indicators (KPIs) that directly drive demand volume. |
Promotion / Price Elasticity Models | Specialized regression models that quantify how demand fluctuates based on changes in price, markdown strategies, or promotional depth (e.g., "A 10% discount increases sales by 15%"). | Sale periods, margin planning. |
Leading Indicator Models | Use early signals that anticipate sales, such as website traffic, social media engagement rates, or pre-order volumes, to create a short-term leading forecast. | Short-term demand sensing and adjusting forecasts just before major product launches or marketing campaigns. |
Pros: Clearly identify external drivers that cause demand changes.
Cons: Require accurate forecasts of the driver variables themselves. Fail if the historical relationship between the driver and sales changes.
Econometric Methods
Complex, large-scale causal models that incorporate macroeconomic factors (e.g., GDP growth, consumer spending, unemployment rates, inflation) to understand long-term demand shifts.
Best for: Long-term, strategic apparel planning (e.g., facility expansion, capital budgeting), useful for justifying capital investments.
Pros: Link demand to the overall health of the economy (e.g., GDP). Reduce reliance on internal sales history alone.
Cons: Requires specialized statistical expertise and software. The drivers (macroeconomic indices) are themselves difficult to forecast accurately.
Intermittent Demand Forecasting
This method is used for styles with sporadic or low-volume sales, common in accessories, luxury items, long-tail SKUs. In these cases, standard Time Series models can fail.
Techniques of this method:
Technique | Description |
|---|---|
Croston’s Method | Separate the forecast into two parts: the size of the non-zero demand, and the interval between those demands. |
SBA (Syntetos-Boylan Approximation) | Correct Croston’s tendency to over-forecast. |
TSB (Teunter-Syntetos-Babai) | Another refinement that incorporates the probability of a zero-demand period, improving accuracy. |
Best for: Niche SKUs, C-class inventory, expensive accessories, made-to-order categories.
Pros: Provides a statistical baseline where standard models fail (due to frequent zero-demand periods).
Cons: More complex than standard methods. Still struggles with extremely low-volume or highly irregular demand patterns. Requires specific modeling tools.
Hierarchical Forecasting
The process of creating and reconciling forecasts at different levels of a business (e.g., Company Total -> Category -> Product Line -> Store -> SKU).
Technique | Description |
|---|---|
Top-Down | Forecast the total company demand first, then allocate down to SKU or store levels. |
Bottom-Up | Forecast every lowest-level item (e.g., every SKU in every store) and then aggregate (sum) them up to the total. |
Middle-Out | Forecast a mid-level aggregate (e.g., a region or a key product category) and then spread the forecast up and down. |
Best for: Large, complex organizations selling across multiple stores, regions, or categories, with SKU-rich fashion catalogs and multi-level reporting needs.
Pros: Ensure consistency across the organization (low-level SKU forecasts sum up to the high-level financial plan). Improve planner buy-in when done well.
Cons: Bottom-Up can be computationally demanding and prone to optimistic bias at the lowest levels. Top-Down risks creating highly accurate totals but practically unusable SKU-level forecasts.
Quantitative Forecasting Methods
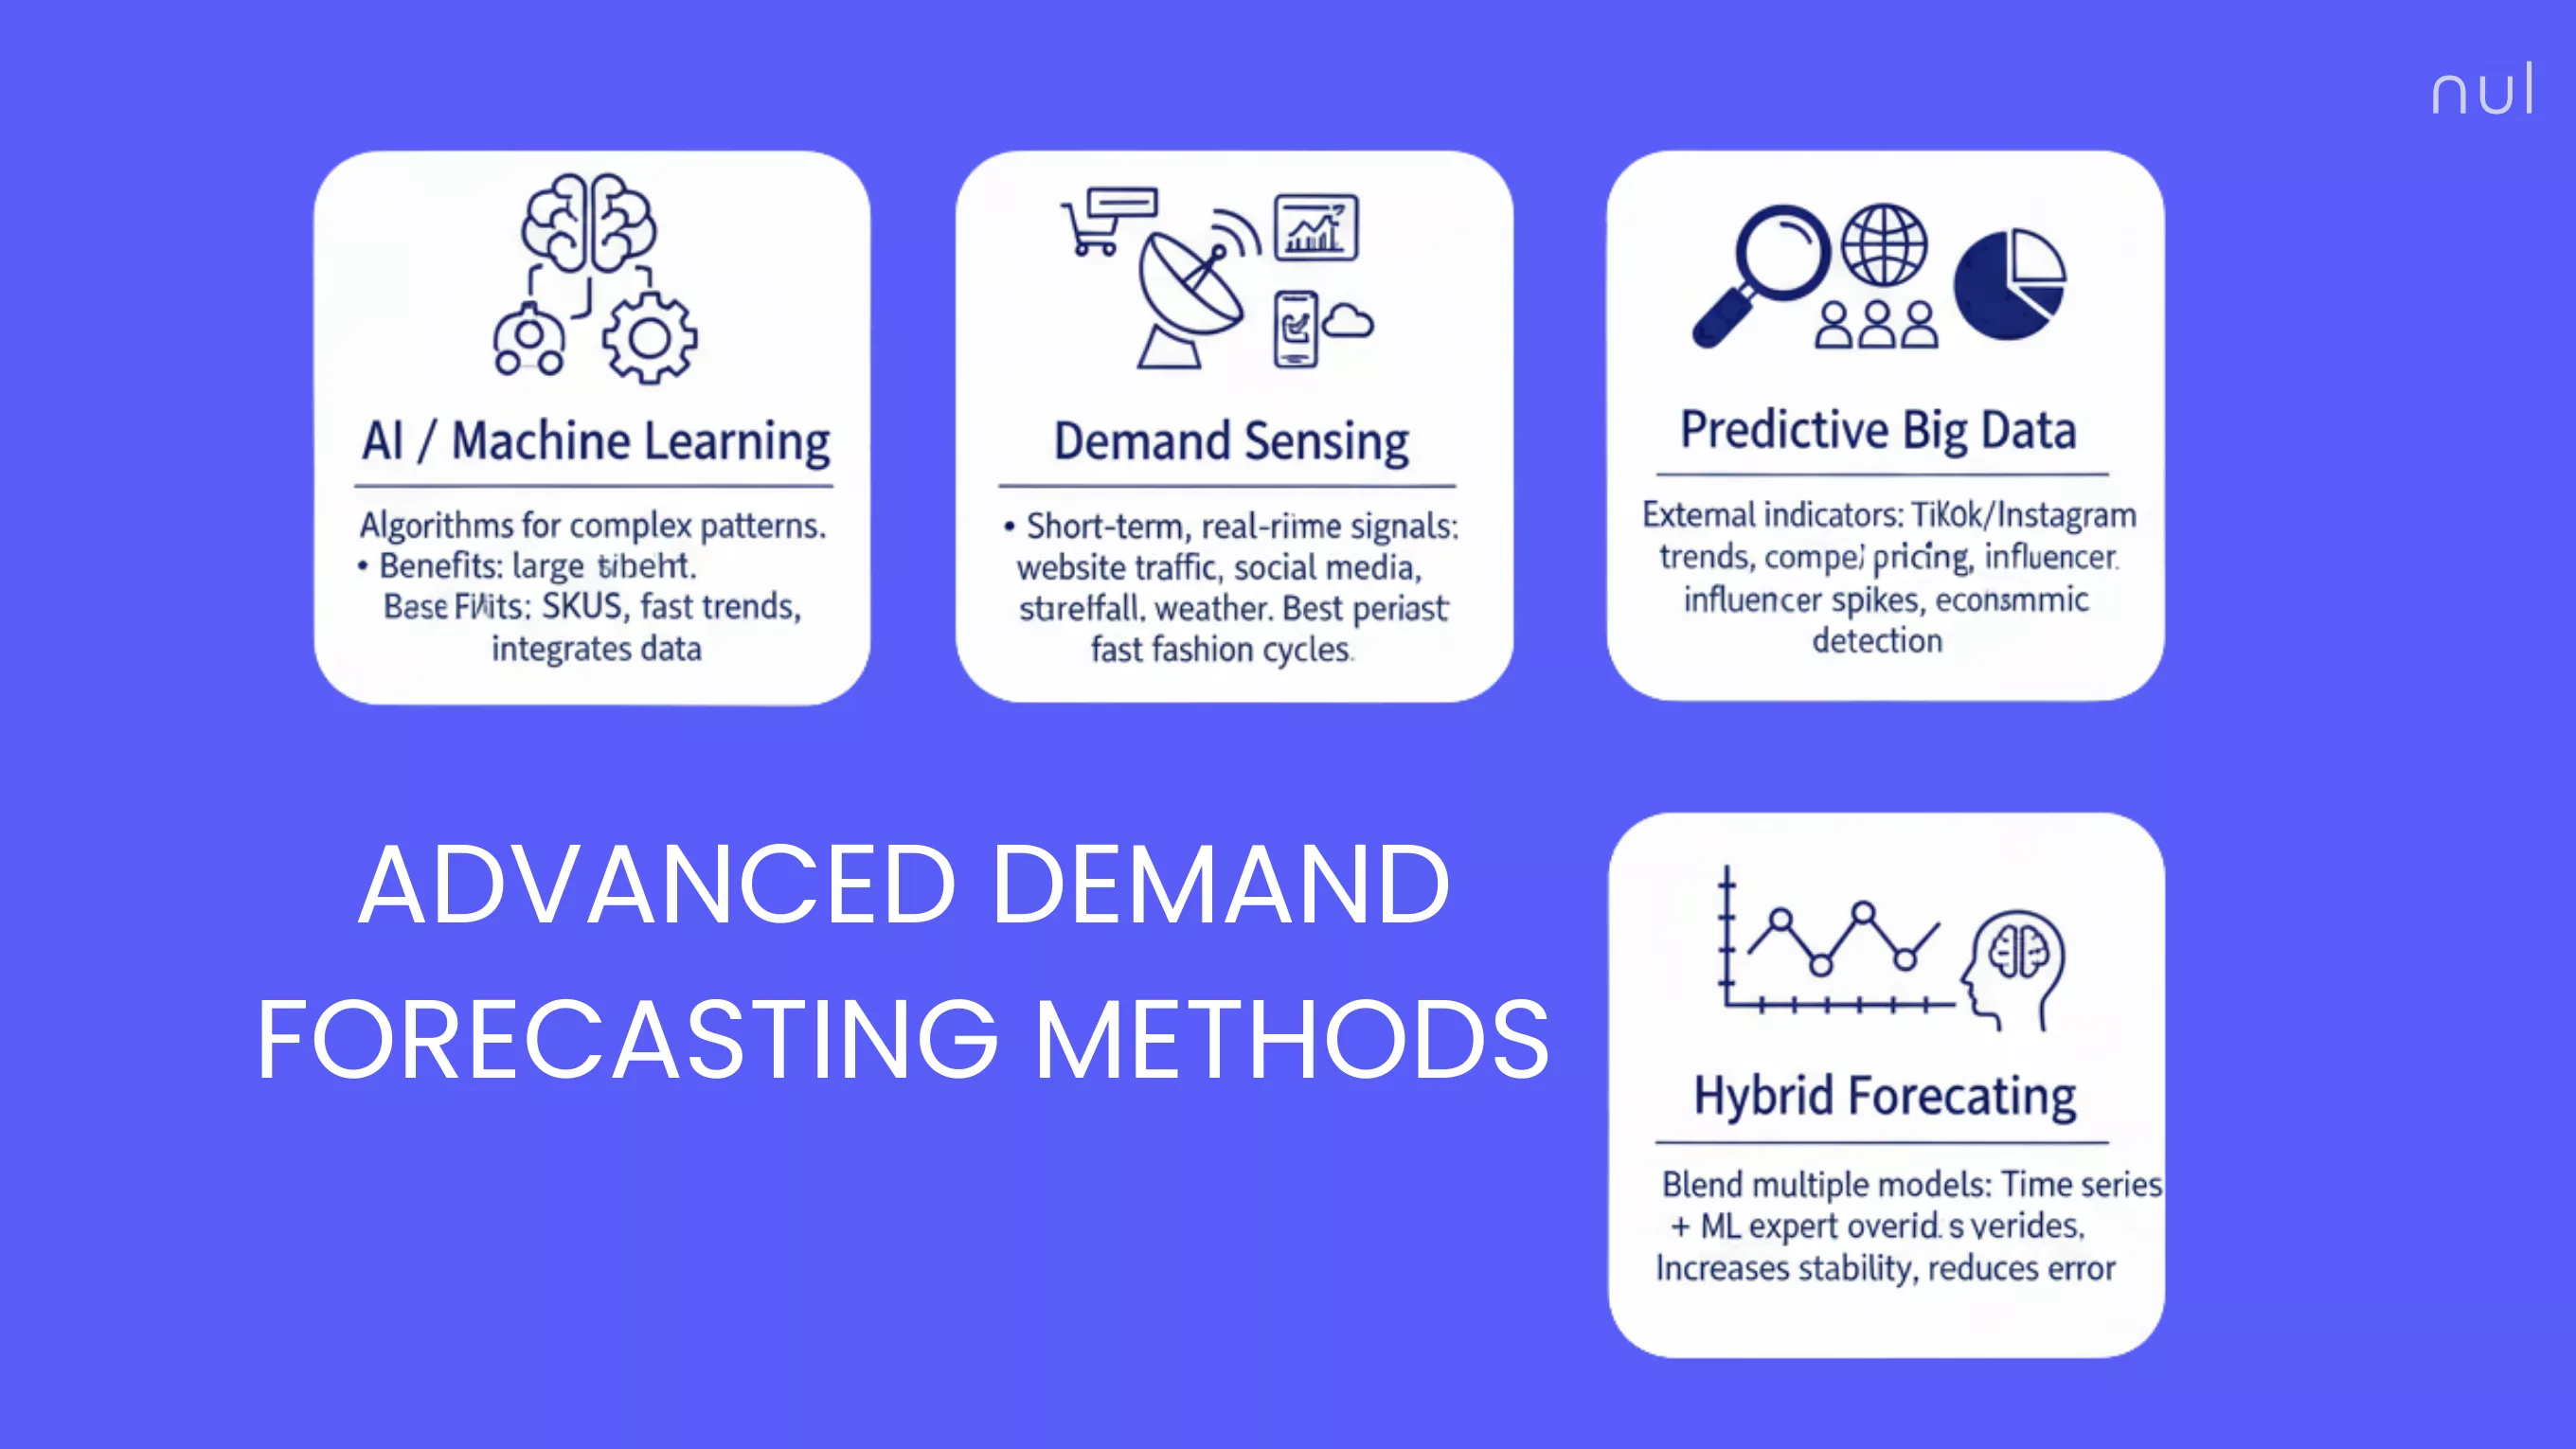
Advanced Forecasting Methods
With retail becoming more complex, fashion brands increasingly use AI-driven forecasting to react faster and reduce overproduction.
AI / Machine Learning Forecasting
AI/ML uses complex non-linear algorithms that learn patterns from massive datasets, far more complex than traditional statistical models can do. These algorithms adjust their own parameters automatically and work well for high-volume SKUs and fast-changing demand. They are considered the most advanced form of quantitative forecasting.
Examples of algorithms:
Gradient Boosting (XGBoost, LightGBM)
Random Forest
Neural networks (RNN, LSTM, Transformer-based models)
Best for: High-volume/high-value portfolios (A-class SKUs), volatile demand patterns, requiring the integration of dozens of causal variables.
Pros: High accuracy in volatile market, handling large SKU volumes, integrating complex multiple data sources (features), automatically detecting non-linear relationships.
Cons: High upfront investment in infrastructure and talent, need clean training data; prone to overfitting (modeling noise instead of signal); results can lack the simple interpretability of regression models ("Black Box" effect).
>> Read more: AI in Fashion Industry: Use Cases, How‑To Guide, Pros & Cons
Demand Sensing
A high-frequency, short-term forecasting technique that uses real-time, minute-by-minute or hourly signals to adjust the immediate-term forecast (0-14 days). It acts as the final "touch" on the forecast to react instantly to market conditions before inventory is committed. Some signals are:
Website traffic;
Social media trends;
Store footfall (in-store and online);
Weather changes;
Stock-outs and replenishment delays;
Current Point-of-Sale (POS) data.
Best For: Optimizing intra-week inventory deployment, responding to fast fashion cycles, and maximizing the current week's sell-through.
Pros: Provide early warnings and maximizes the "sell-through" window; actionable for inventory allocation.
Cons: Need reliable real-time data feeds; adjustments are often too late for offshore production planning.
Predictive Big Data Analytics
Models that incorporate external market indicators:
This method focuses on integrating and structuring vast historical and external datasets from the Big Data pool to improve the accuracy and depth of long-term quantitative models. It transforms complex external data signals into usable features that influence the forecast baseline.
Search engine data;
Competitor pricing;
Influencer spikes;
Macroeconomic shifts.
Best for: Early trend detection and pre-season planning, setting long-range strategic financial targets.
Pros: Improve the predictive power of ML and regression models, allow forecasts to anticipate trend shifts based on market signals.
Cons: Data is often unstructured and requires heavy cleaning/engineering; require historical data to establish reliable relationships.
Hybrid Forecasting
Different forecasting methods are combined to leverage their individual strengths and stabilize the final output. For example:
70% to a stable Time Series baseline and 30% to a ML trend model).
Combining a Time Series model for the baseline trend and a Regression model for the causal uplift (promotions).
Using human judgment to adjust the final machine-generated forecast.
Best For: Reducing forecast error across a varied portfolio of SKUs; maximizing stability while incorporating advanced insights.
Pros: More robust and stable than any single model, mitigating the risk of a single model failing.
Cons: Increased complexity in management and documentation, requiring planners to understand the relative merits of different models.
Advanced Forecasting Methods
How to Choose the Right Demand Forecasting Method?
Use this decision framework:
1. Data Availability
Low or no data: qualitative, analogy, expert judgment
Moderate data: moving averages, regression, exponential smoothing
High data volumes: ARIMA, ML, hybrid models
2. Demand Stability
Stable demand: time series models
Volatile demand: regression, ML, causal models
Intermittent demand: Croston/SBA/TSB
3. Product Lifecycle Stage
New product: qualitative + leading indicators
Mature product: time series + ML
End-of-life: manual overrides + scenario planning
4. Forecast Horizon
Short-term: demand sensing, ML
Medium-term: Holt-Winters, ARIMA, regression
Long-term: econometric models, Delphi
5. SKU Volume & Business Complexity
Large SKU count: hierarchical + ML
Small catalog: time series + expert insight
Forecast Accuracy Metrics
To evaluate forecast quality, track:
Metric | Description | When to Use It |
|---|---|---|
MAPE (Mean Absolute Percentage Error) | Measures the average size of the error as a percentage of actual demand. | Communicating accuracy to executives and for comparing performance across different product lines. |
WAPE (Weighted Absolute Percentage Error) | Measures the average percentage error, but gives higher weight to high-volume items. | Dealing with a wide variety of SKU volumes (e.g., comparing accuracy of high-volume core items vs. low-volume niche items). |
MAE (Mean Absolute Error) | Measures the average size of the error in actual units or currency. | Useful for planners, as it provides a clear average error (e.g., "We are typically off by 50 units"). |
RMSE (Root Mean Square Error) | Applies a greater penalty to large forecasting errors than to small ones by squaring the error. | High-value or high-risk items where one mistake can cause big impacts (e.g., forecasting for a very expensive or sensitive component). |
Bias | Indicates whether the forecast consistently over- or under-predicts. | Directly informs inventory replenishment, safety stock levels, and inventory holding costs. |
Conclusion
Demand forecasting is both an art and a science, especially in fashion, where seasonality, trends, and consumer behaviour shift rapidly. The best brands use a mix of qualitative insight, quantitative rigor, and modern AI-powered approaches to stay ahead.
Whether you’re a growing fashion label or an enterprise retailer, choosing the right demand forecasting methods will help you:
Buy smarter
Avoid stock-outs
Protect margins
Plan with confidence
Looking for more? Dive into our other articles, updates, and strategies


Let's show you how
