" height="22.21672870003851px" id="z3WvM4hhx" transform="translate(0 7.783)" width="44.5160044463523px"/><path d="M 0 0 L 2.973 0 L 2.973 29.237 L 0 29.237 Z" fill="rgb(51, 51, 65)" height="29.23683002950565px" id="JHCCz3Moo" transform="translate(52.332 0)" width="2.9732091795568465px"/><path d="M 0 0 L 18.335 0 L 18.335 2.973 L 0 2.973 Z" fill="rgb(88, 93, 247)" height="2.9732091795568505px" id="TtL1Ujsfx" transform="translate(26.217 3.072)" width="18.334926489198978px"/><path d="M 0 1.817 C 0 0.813 0.813 0 1.817 0 C 2.82 0 3.634 0.813 3.634 1.817 C 3.634 2.82 2.82 3.634 1.817 3.634 C 0.813 3.634 0 2.82 0 1.817 Z" fill="rgb(88, 93, 247)" height="3.633967846768943px" id="E_sZ1ZJZP" transform="translate(57.862 26.217)" width="3.6339678467688827px"/></g></svg>)
12 Best Practices in Forecasting and Demand Planning 2026
Use clean data, segment products, choose suitable methods, include external data, apply AI/ML, automate workflows,... are the best demand forecasting best practices.

Nūl Content Team
An Experienced Research & Knowledge Team
The Nūl Content Team combines expertise in technology, fashion, and supply chain management to deliver clear, practical insights. Guided by Nūl’s mission to end overproduction, we create content that helps brands forecast demand more accurately, optimize inventory, and build sustainable operations. Every piece we publish is grounded in real-world experience, ensuring it’s both credible and actionable.

Table of contents
Demand forecasting is the key factor for modern retail and fashion supply chains to either fail or succeed. With fast-changing trends, multi-channel sales, global production timelines, and increasing pressure to reduce overproduction, forecasting is no longer optional, it’s a competitive advantage.
But forecasting isn't just about choosing a model. The real magic comes from consistent, disciplined best practices around data, collaboration, and process. This guide breaks down 12 practical demand forecasting best practices fashion brands can apply today, no theory, just what works in the real world.
Use Clean and Clear Data
You can’t produce an accurate forecast with messy inputs. Clean data means:
Correct SKU codes and product attributes;
Accurate timestamps (order dates, fulfilment dates);
Clear channel mapping (POS, DTC, wholesale);
Properly tagged returns and cancellations.
Clean and clear data also means your historical records accurately reflect true customer demand by isolating noise and contextualizing sales.
Before forecasting, ensure you:
Remove outliers (e.g., viral spikes, stock-out periods);
Remove backorders and cancellations from the demand stream;
Fill missing values or reconcile broken SKU histories.
Simple data-cleaning checklist:
✔ Is the SKU history complete?
✔ Were stock-outs removed?
✔ Are promotions labeled?
✔ Are returns properly accounted for?
Always note that clean inputs lead to cleaner forecasts.
Segment Your Products
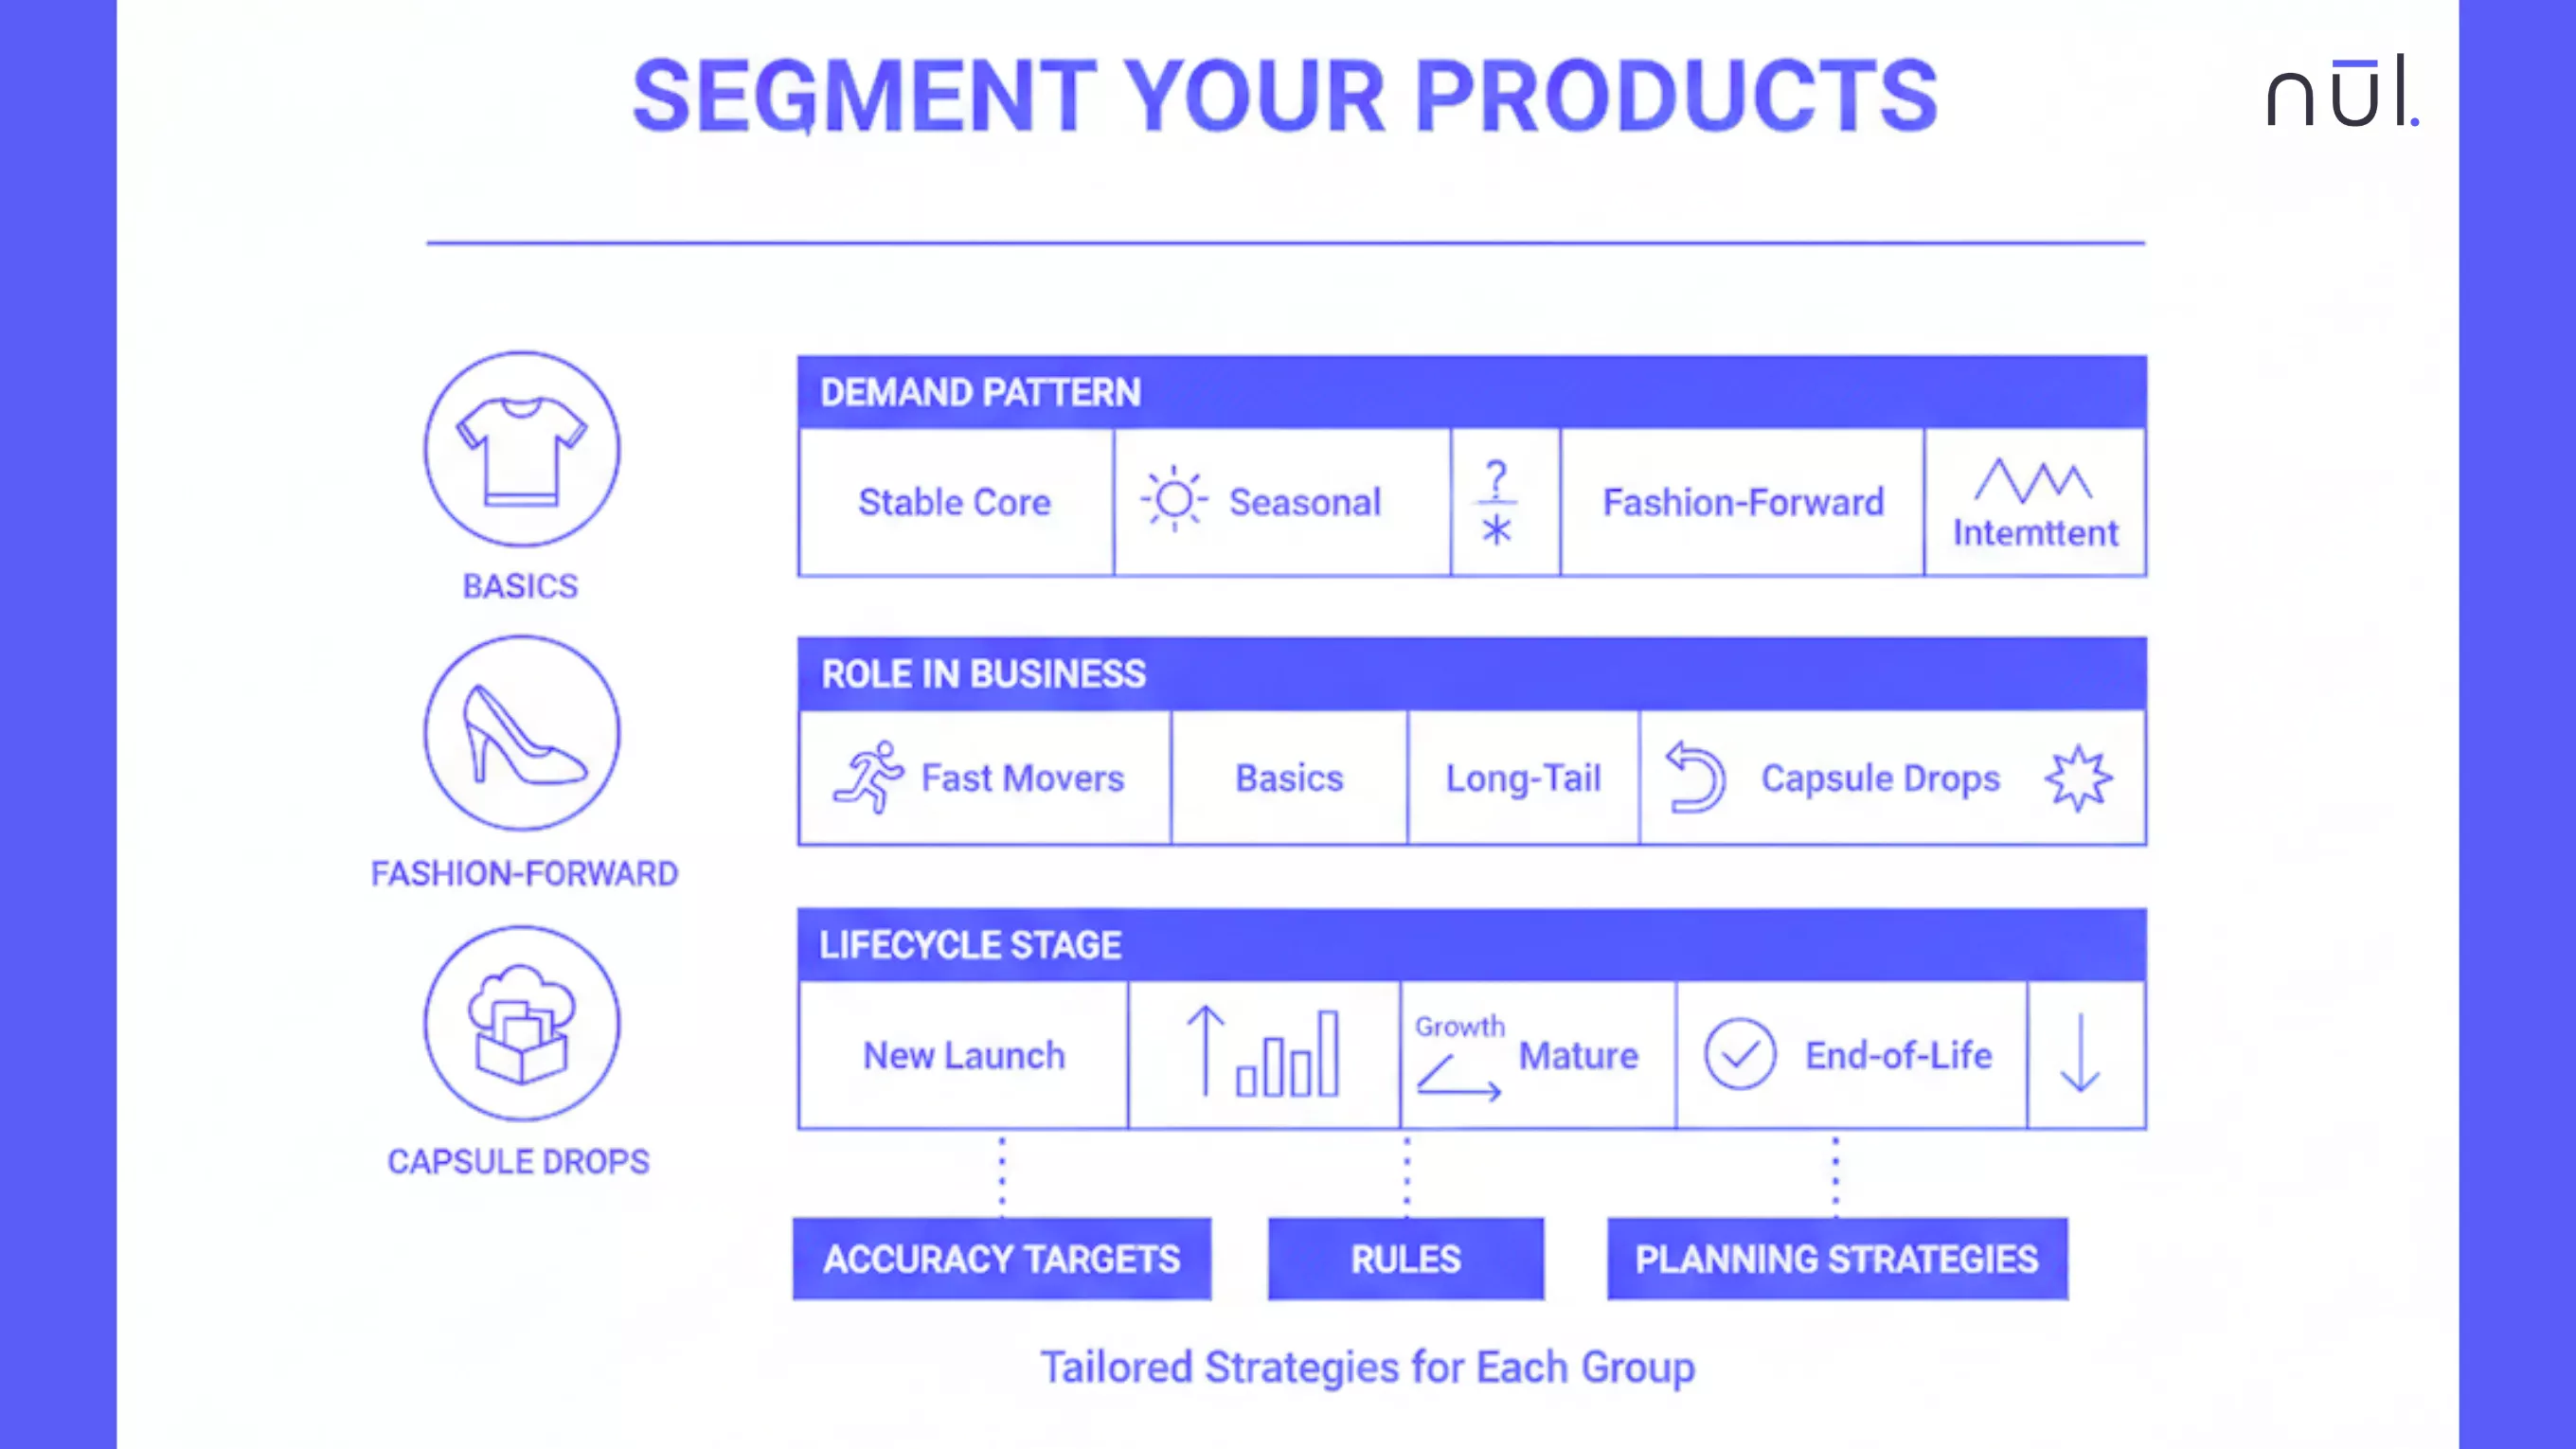
Not all SKUs behave the same, so they shouldn’t be forecasted the same. Segmentation is to logically divide your inventory into smaller, manageable groups based on similar characteristics. This helps you know what you are trying to predict and understand the underlying forecasting challenge each group represents.
Segment by:
Demand pattern: Classify products by their sales stability like stable core, seasonal, fashion-forward, intermittent.
Role in business: Define the item's strategic importance, distinguishing between fast movers, basics, long-tail, and capsule drops.
Lifecycle stage: new launch, growth, mature, end-of-life.
In short, segmentation allows different accuracy targets, rules, and planning strategies for each group.
>> You can learn: A Complete Guide to Seasonal Inventory Management in Fashion
Segmentation is to logically divide your inventory into smaller, manageable groups.
Choose Methods By Use Case
Once a product is segmented, you can select appropriate demand forecasting methods to predict its behavior accurately. The best method depends on what you’re forecasting, for example:
Stable basics: moving average, exponential smoothing;
Highly seasonal categories: Holt-Winters, SARIMA;
Promo-driven items: regression or ML models;
New launches: qualitative judgment + market indicators;
Intermittent demand: Croston/TSB.
Actually, there is no the best model. The right choice depends on the SKU’s behavior and the decision you’re supporting, for example, purchase order, inventory replenishment, or allocation. In many cases, you can also combine different approaches to have a more complete and reliable view of demand.
One more tip is that considering dedicated demand forecasting tools to support your chosen methods In fact, spreadsheets are fine for small or simple catalogs, but growing or multi-channel businesses really need smart tools to handle larger data sets and more complex patterns.
Incorporate External Drivers
Forecasts fall apart when external drivers are ignored. External drivers and causal factors are the events outside of normal, steady sales patterns that influence customer behavior. These factors are important because they help separate your stable baseline demand from temporary sales lifts. Key influencers include:
Weather changes
Public holidays
Promotions, markdowns strategies, and campaigns
Influencer spikes and social media virality
Macroeconomic shifts (consumer sentiment, inflation)
How to incorporate them:
Maintain a promo calendar: This calendar must be the single source of truth, detailing the start date, end date, specific depth of discount (e.g., 20% off), and the targeted product list.
Tag weather-sensitive categories (e.g., outerwear, swim): Once tagged, integrate local weather forecast data directly into the model for those specific segments.
Bring marketing plans into forecasting discussions: Marketing provides warning of planned high-traffic events (e.g., a major influencer drop or a new product launch advertisement) that create demand spikes.
Finally, external context transforms raw numbers into real demand.
Apply AI and Machine Learning
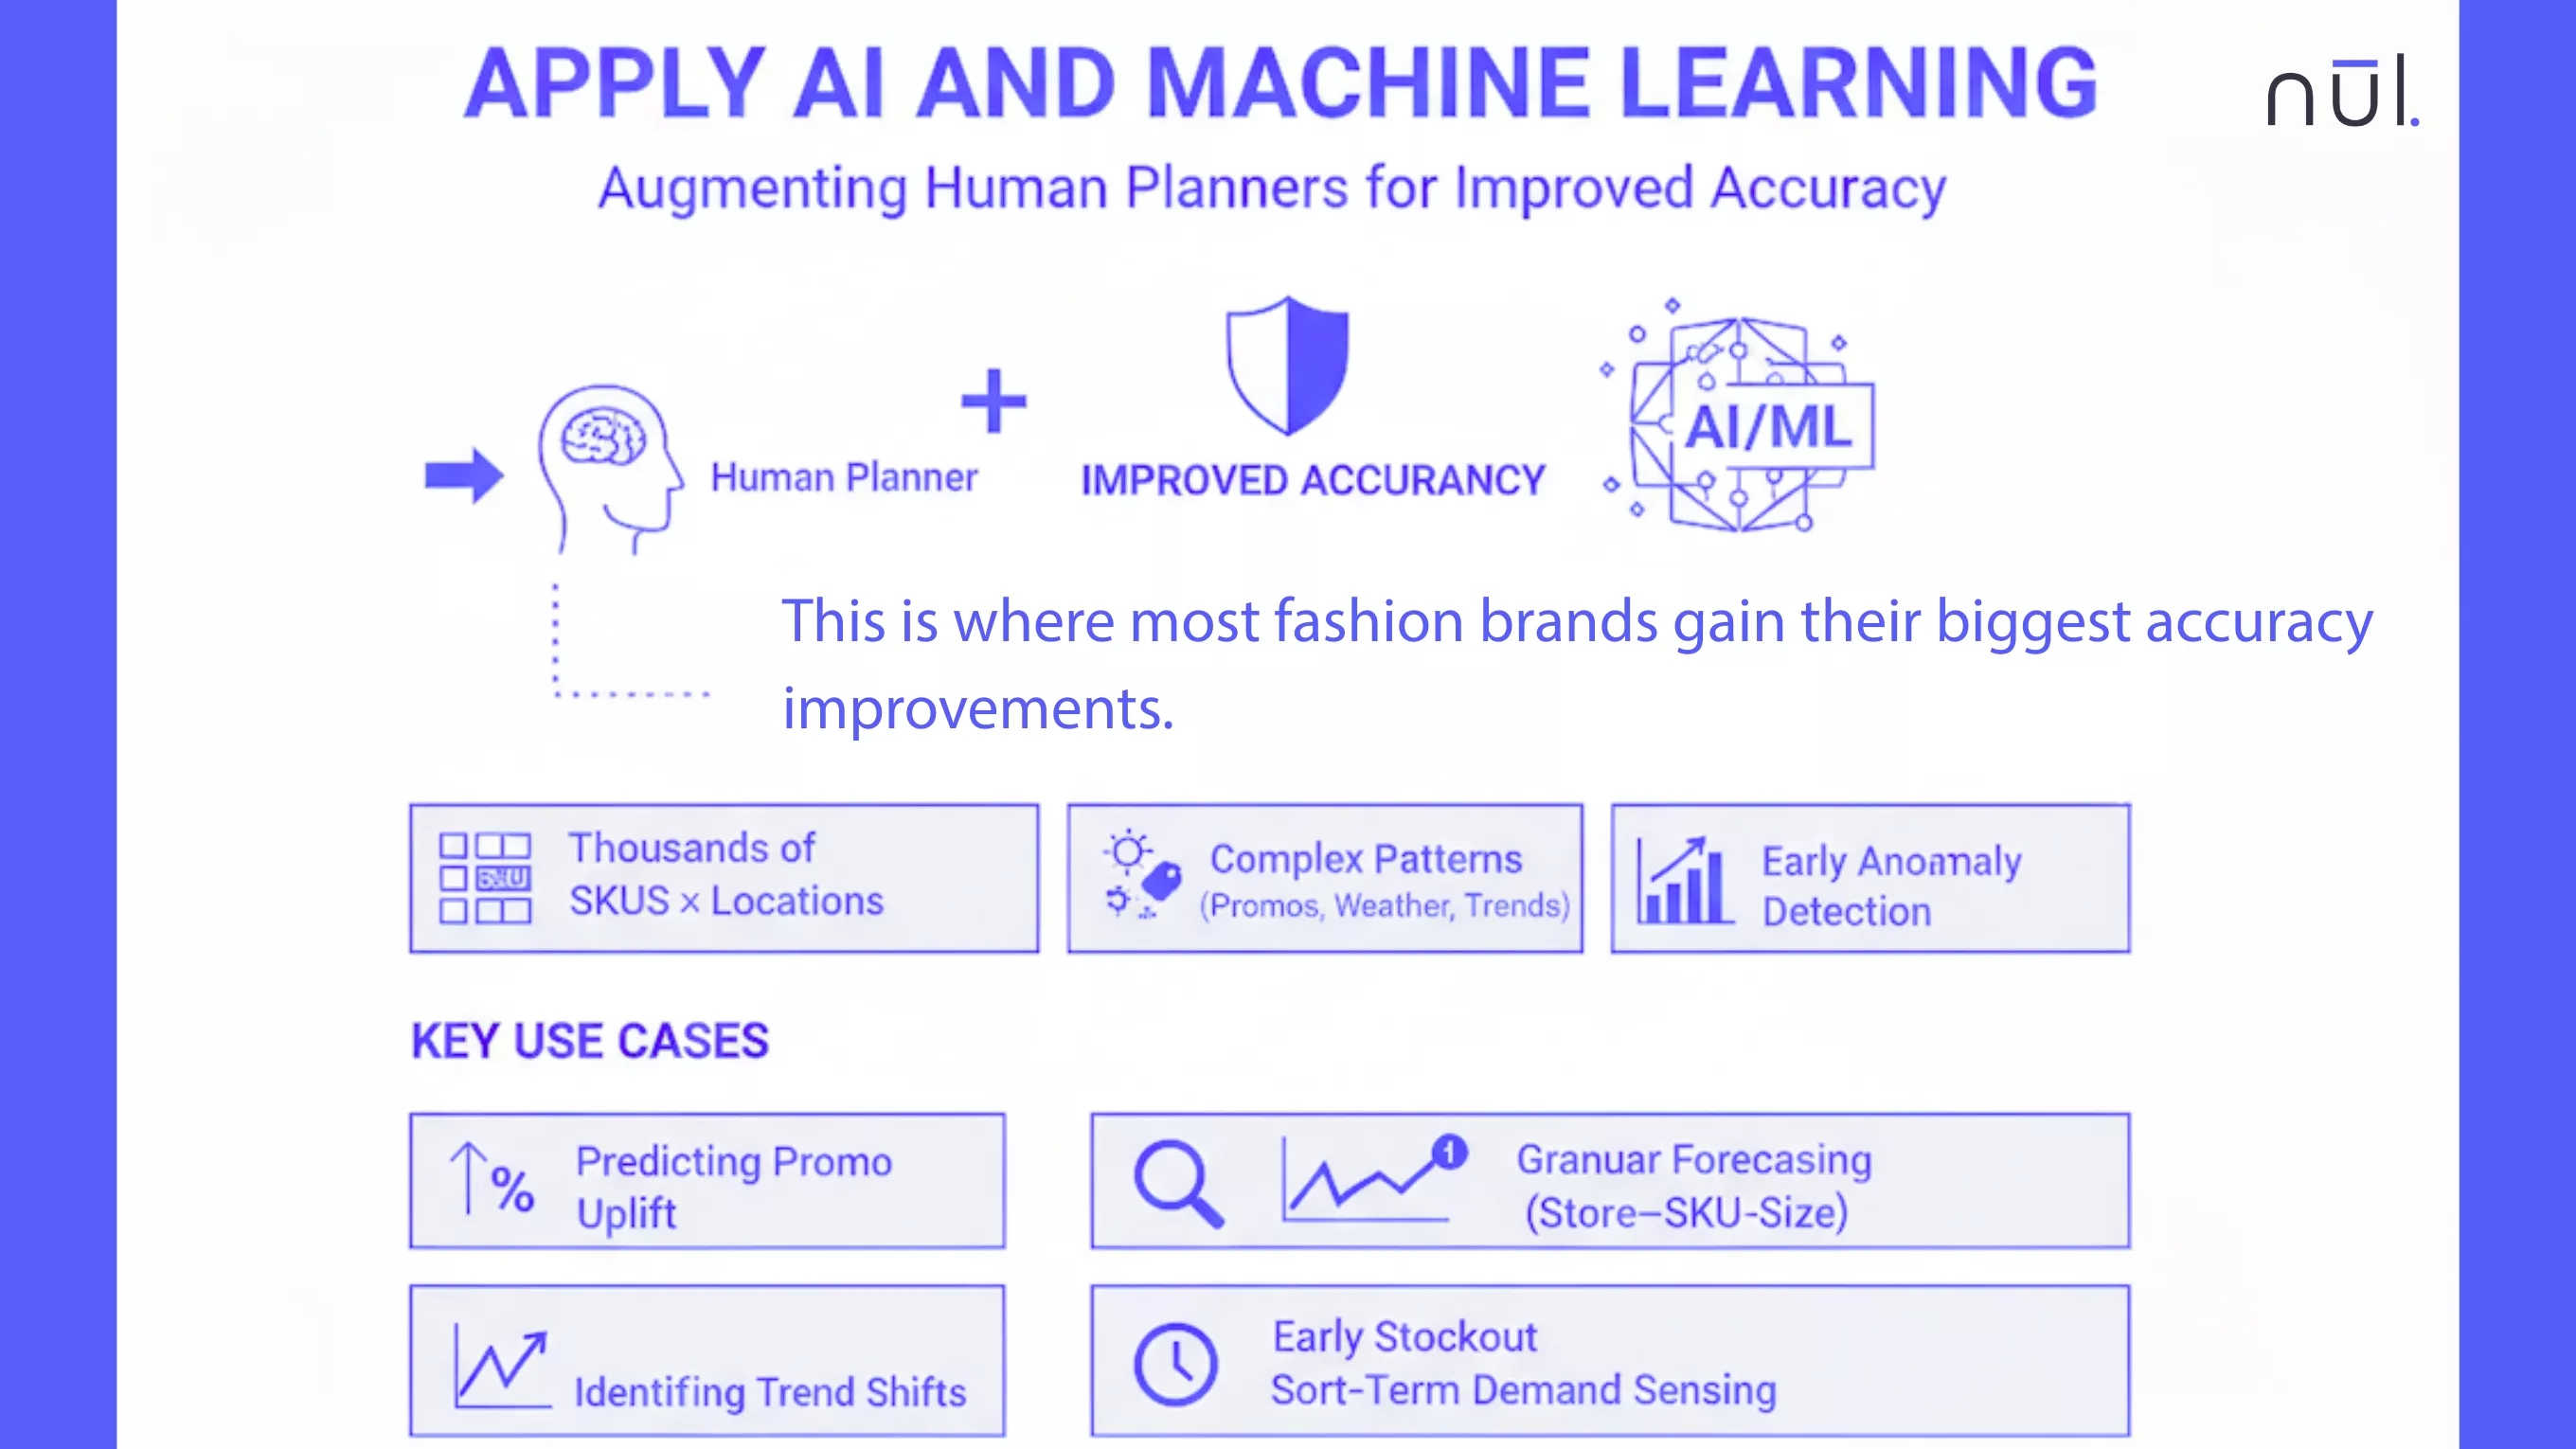
Application of Artificial Intelligence (AI) and Machine Learning (ML) in demand forecasting is more and more popular as they help modern brands improve accuracy. This practice doesn't replace the human planner, it augments them.
AI/ML enhances forecasting by:
Handling thousands of SKUs × locations;
Learning complex patterns across promotions, price, weather, and trends;
Detecting anomalies early;
Forecasting at granular levels (store–SKU–size).
Here are some use cases that AI/ML are really helpful:
Predicting promo uplift;
Identifying sudden trend shifts;
Early warnings for stockouts;
This is where most fashion brands gain their biggest accuracy improvements.
Application of AI/ML in demand forecasting is more and more popular.
Automate Forecast Workflows
By automating routine, repetitive tasks, you reduces manual workload and errors and ensure your forecasts are always timely. Planners thus dedicate their time and experience to strategic analysis, rather than low-value data management.
What to automate:
Data refresh: Automate the connection and synchronization of data across systems (e.g., POS, ERP, WMS). The system should automatically run essential cleansing steps.
Daily/weekly forecast runs: Schedule the daily or weekly execution of your forecasting models and monthly execution pre-season for long-term planning.
Report generation: Automatically generate performance reports (e.g., Forecast vs. Actual) and send them to relevant stakeholders.
Stockout alerts and exception flags: Alert planners when a forecast is significantly off-track or when inventory falls below the critical safety threshold.
Integrate Forecasts With Inventory
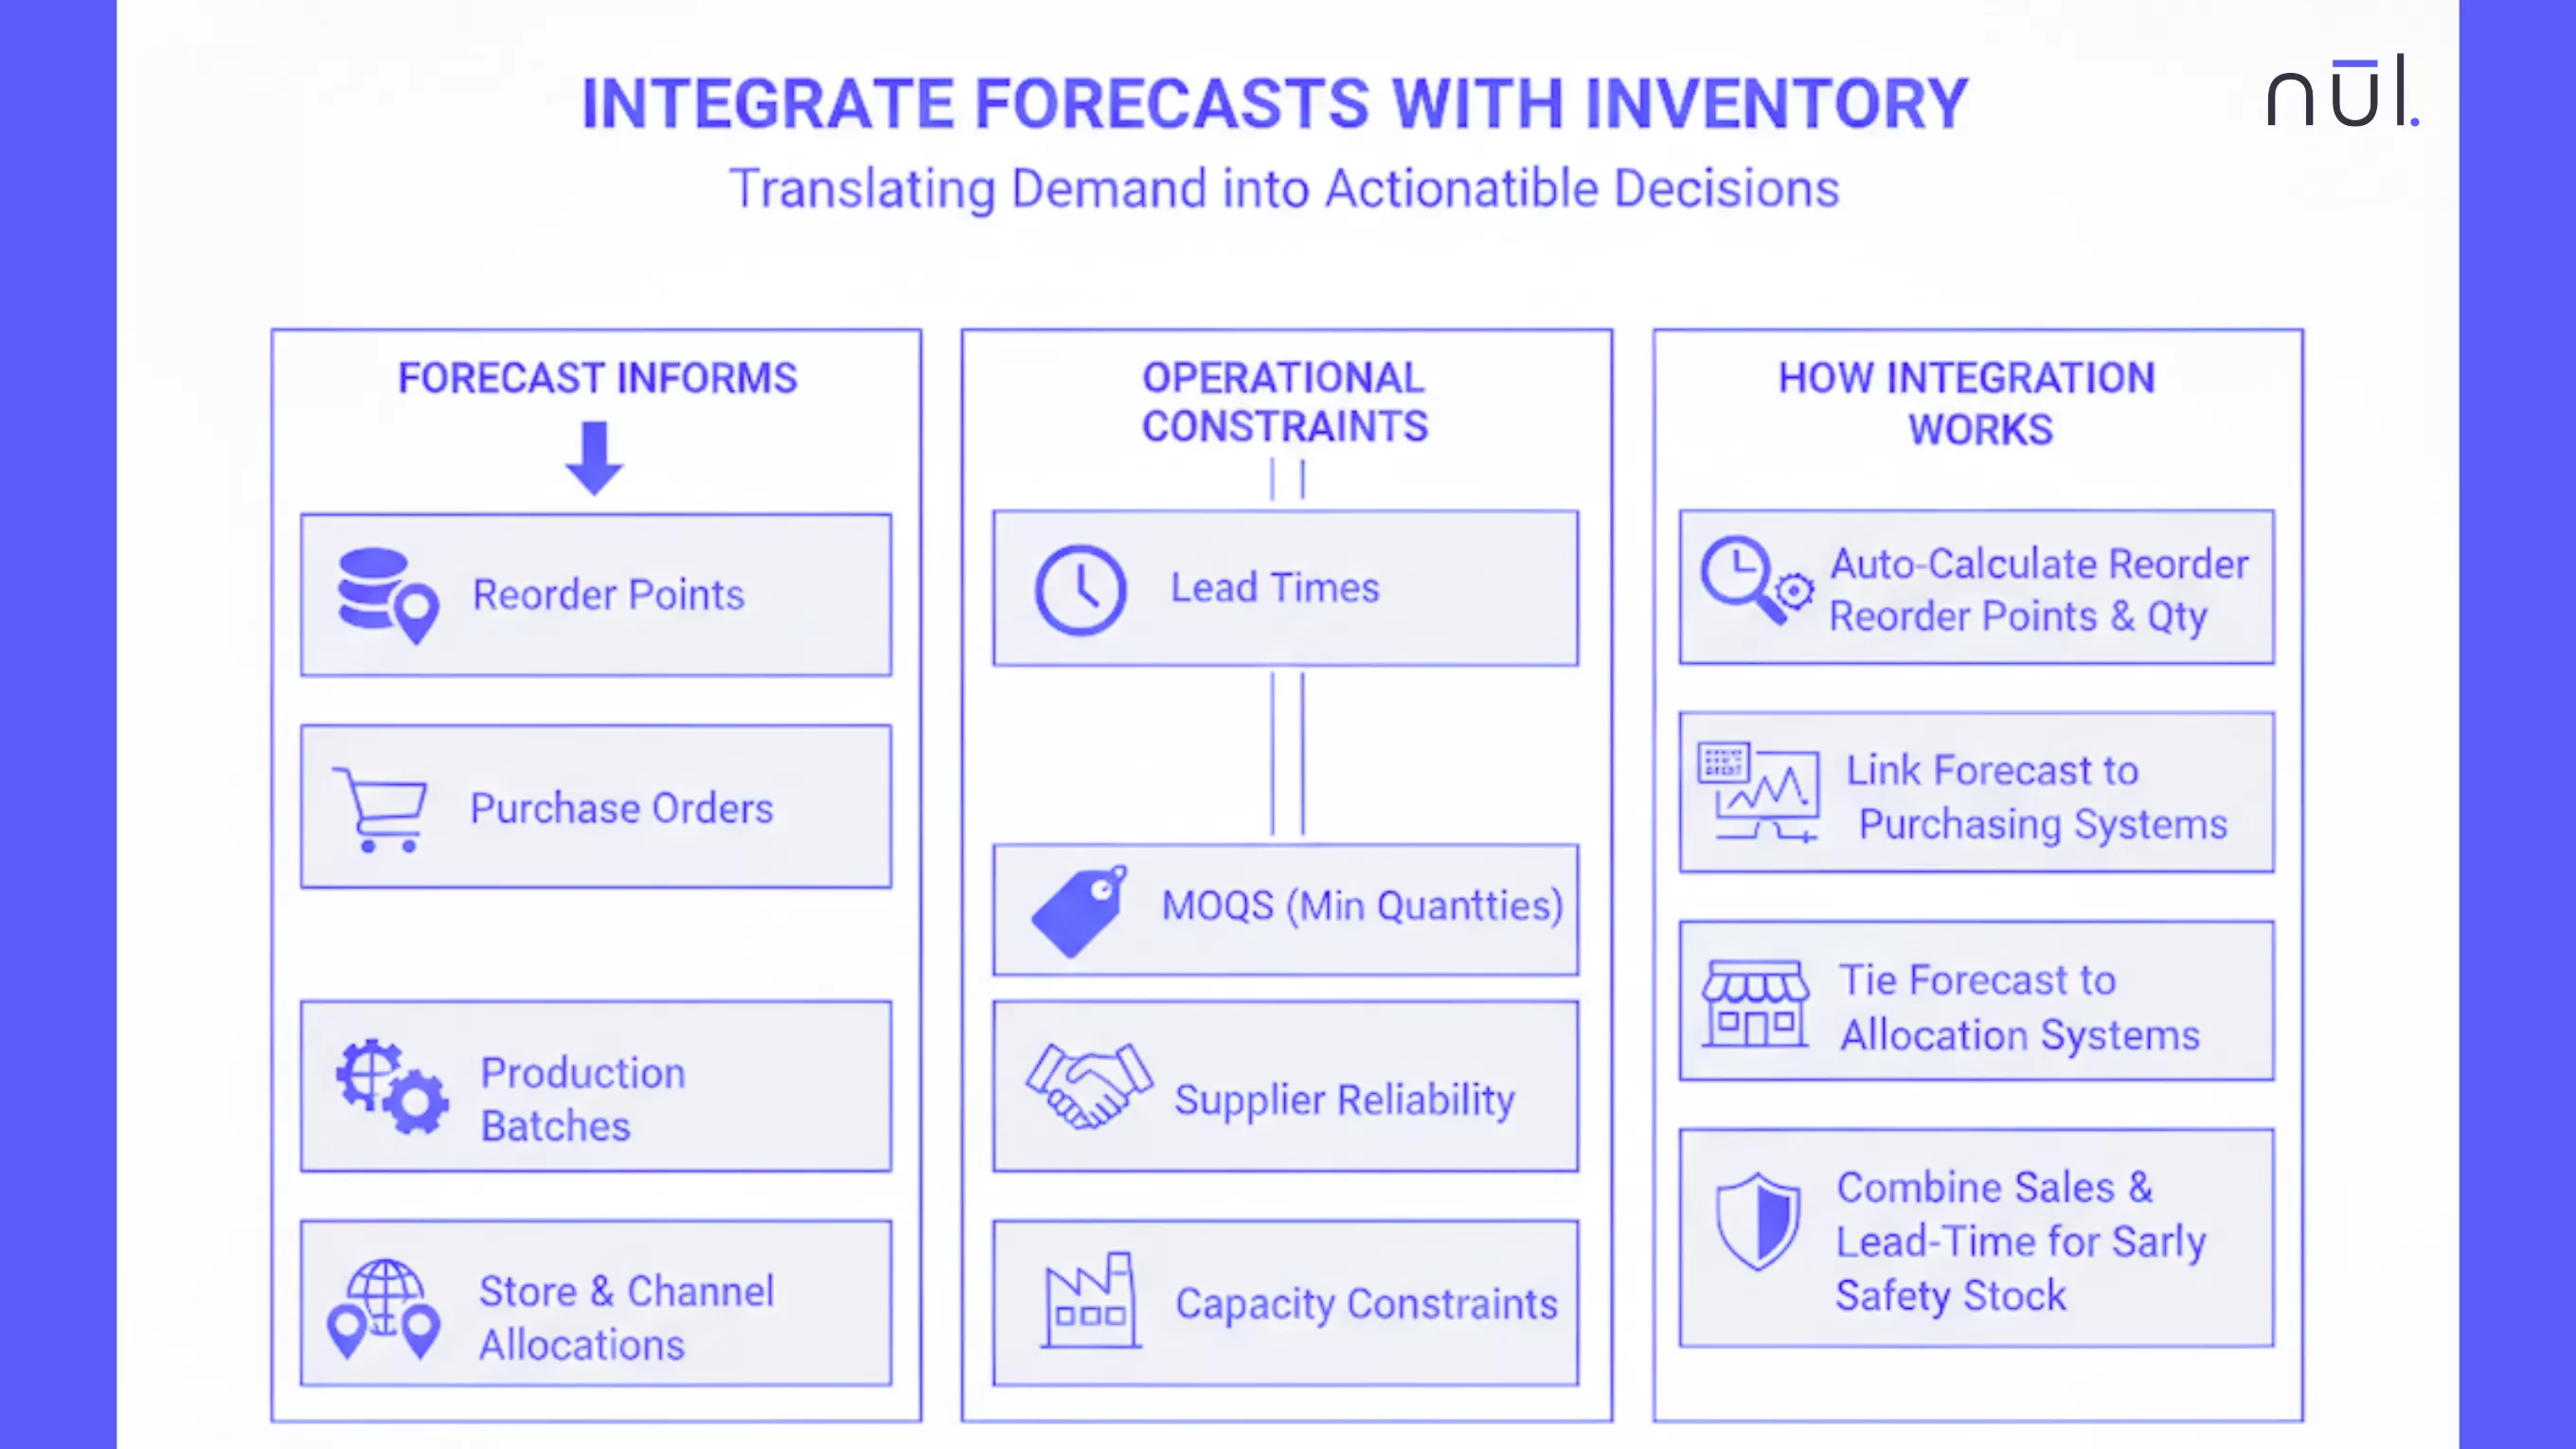
A demand forecast is just a number and only valuable if it is translated into actionable inventory and production decisions. Your forecast should directly inform:
Reorder points: Determine the exact stock level that triggers a new replenishment order.
Purchase orders: Decide how much to buy for the next cycle, based on expected demand and supplier capacity.
Production batches: Help suppliers plan fabric, trims, and cutting schedules more accurately.
Store and channel allocations: Distribute inventory across regions, stores, and online channels according to forecasted demand patterns.
To make this work, the forecast must be connected to operational constraints, including:
Lead times: If a supplier needs 60 days, your order timing must reflect that.
MOQs: Some suppliers require minimum quantities, which can change buy decisions.
Supplier reliability: If a supplier is often late, safety stock or earlier PO placement may be needed.
Capacity constraints: Limited sewing lines or warehouse space may require staggered production or split deliveries.
How integration works in practice:
Use the forecast to calculate reorder points and reorder quantities automatically.
Link forecasted demand to purchasing systems so POs follow actual needs rather than static rules.
Tie store-level and channel-level forecasts to allocation systems so inventory is placed where it will sell fastest.
Combine forecasted sales with lead-time variability to compute the right safety stock.
Example: If swimwear demand is forecasted to spike in Feb, you align POs in Nov and allocate more to regions with early heat waves.
A demand forecast is only valuable if it is translated into actionable inventory.
Standardize Review Cadence
Great forecasting requires a rhythm. Regular check-ins help teams catch issues early, understand why a forecast missed, and adjust quickly for the next cycle. Without a set cadence, insights get lost and accuracy is down.
Suggested cadences:
Monthly forecast reconciliation: Compare the full forecast against actuals, looking at categories, regions, and channels.
Weekly in-season reviews: Quick check-ins during fast-moving periods to spot early shifts and make small corrections.
Post-season debriefs: A deeper look at what worked, what didn’t, and which assumptions should change next season.
Each review should cover:
Forecast vs actual performance across key segments;
Categories or SKUs with large errors;
Root causes (promo impact, launch delays, weather, data issues, supply constraints);
Actions taken such as markdown decisions, reorders, allocation changes, or PO adjustments.
Don't forget to document everything. Over time, these patterns guide better assumptions, improve model selection, and help teams avoid repeating the same mistakes. A consistent review cadence turns forecasting into a learning system rather than a static process.
Measure Forecast Accuracy
Accuracy isn’t a feeling it’s a quantifiable metric. Clear metrics help you see where the forecast performs well, where it fails, and what adjustments are needed.
To get a complete picture of performance, you must use a diverse set of metrics that measure different aspects of error (e.g., scale vs. direction). Here are key metrics to use:
MAPE: Shows the average percentage error, making it easy to compare across categories.
Bias: Reveals whether you consistently over-forecast or under-forecast.
WAPE: Useful for large SKU mixes because it weighs errors by sales volume.
MAE / RMSE: Show the size of the error in units, helping you understand the real business impact.
Track accuracy by multiple views:
Category: Some categories behave more unpredictably.
Channel: Online vs store demand often follows different patterns.
Region: Climate, culture, and local events affect demand differently.
Lifecycle stage: New launches and end-of-life items tend to have lower accuracy.
But note one thing that metrics help you improve; they should never be used to punish planners.
Improve Models From Results
A forecast is only valuable if you learn from its mistakes. This creates a continuous improvement loop, ensuring that your investment in measuring accuracy directly translates into a stronger, more intelligent forecasting engine every cycle.
Use accuracy results to:
Adjust smoothing parameters: Fine-tune simple models when they react too slowly or too aggressively to changes.
Switch methods for certain segments: If a method misses for a category, try a different approach better suited to its pattern.
Add new external drivers: Bring in weather, promotions, or marketing signals if errors suggest these factors influence demand.
Retrain machine learning models: Update ML models with fresh data to keep them aligned with current trends and shopper behavior.
Test changes in a small scope first: Run improvements on one category or region before applying them across the full catalog.
Collaborate Across Functions
Demand planning is not something one department can manage alone. Accurate forecasts depend on information that lives across merchandising, planning, marketing, finance, and operations. When teams share updates and work from the same assumptions, the entire forecasting workflow becomes more reliable.
Teams that should stay involved:
Merchandising: Shares assortment plans, launch timing, and product changes.
Planning: Owns the quantitative forecast and the responsibility for inventory allocation.
E-commerce: Provides visibility into channel-specific logistics, current stock availability, and immediate sales performance.
Retail operations: Reports store-level patterns and local demand signals.
Marketing: Controls the levers of demand (campaigns, influencers, traffic generation) that directly cause forecast spikes.
Finance: Provides the overall budget, margin targets, and inventory valuation goals that the forecast must align with.
Why collaboration matters:
Launch dates often move, changing expected sales peaks.
Promotions or markdowns can shift demand sharply.
Budget updates may limit buying decisions.
Price changes affect unit demand and elasticity.
Marketing campaigns drive traffic surges that models cannot predict alone.
How to stay aligned:
Use shared dashboards so everyone sees the same forecast and assumptions.
Hold light, regular S&OP-style check-ins to discuss changes and agree on actions.
Document decisions and updates so nothing is lost between teams.
Account For Lead Time Variability
Accurate demand forecasts won’t help if the lead times behind them are wrong. Lead times often shift due to supplier delays, material shortages, or production bottlenecks. Planning with a single “average lead time” can result in stockouts or excess inventory. To avoid this, build lead-time variability directly into your buying and replenishment decisions.
Factor in:
Average supplier lead time: The baseline number of days it usually takes to receive goods.
Variability and common delays: Seasonal congestion, holidays, or supplier inconsistencies that extend lead times.
Fabric and trim sourcing: Material availability often adds 30–90 days before production even starts.
Production capacity: Limited sewing lines, cut-and-sew time, or factory schedules may push delivery timelines.
Fashion example: Fabric might take 60–90 days, but replenishing core tees may take just 2 weeks. These differences must shape your buy plan, safety stock, and PO timing.
How to use this in planning:
Set reorder points based on both forecasted demand and variable lead times.
Increase safety stock for suppliers or categories with unpredictable timelines.
Place POs earlier for categories with long material lead times, especially seasonal products.
Use shorter cycles for basics and replenishable items where lead times are stable.
>> Read more:
A Complete Guide to Raw Material Management for Brands
A Full Guide to Bill of Materials (BOMs) Inventory Management
How Nūl Helps Fashion Brands Apply These Best Practices?
Nūl is designed specifically for fashion brands to operationalize modern forecasting best practices without the manual work.
Nūl enables brands to:
Clean and normalize data automatically across Shopify, POS, and ERP;
Segment SKUs by demand pattern, velocity, and lifecycle;
Use AI-powered forecasting models calibrated for fashion seasons and short-term demand signals;
Integrate forecasts with POs, inventory, materials, and replenishment;
Automate weekly forecast runs and generate actionable insights via Zoey;
Track forecast accuracy with built-in metrics like MAPE, WAPE, and bias;
Improve models continuously based on real performance;
Collaborate across teams with shared dashboards and S&OP-friendly views.
Nūl turns forecasting from a manual spreadsheet task into a strategic, automated workflow that empowers planners, protects margins, and reduces waste in fashion.
Conclusion
Demand forecasting in fashion is challenging, but with the right best practices, brands can dramatically improve accuracy, reduce stockouts, and avoid costly overproduction. Clean data, segmentation, automation, collaboration, and continuous improvement are the fundamentals. Layer AI and smart workflows on top, and forecasting becomes a powerful engine for growth.
Looking for more? Dive into our other articles, updates, and strategies


Let's show you how
