" height="22.21672870003851px" id="z3WvM4hhx" transform="translate(0 7.783)" width="44.5160044463523px"/><path d="M 0 0 L 2.973 0 L 2.973 29.237 L 0 29.237 Z" fill="rgb(51, 51, 65)" height="29.23683002950565px" id="JHCCz3Moo" transform="translate(52.332 0)" width="2.9732091795568465px"/><path d="M 0 0 L 18.335 0 L 18.335 2.973 L 0 2.973 Z" fill="rgb(88, 93, 247)" height="2.9732091795568505px" id="TtL1Ujsfx" transform="translate(26.217 3.072)" width="18.334926489198978px"/><path d="M 0 1.817 C 0 0.813 0.813 0 1.817 0 C 2.82 0 3.634 0.813 3.634 1.817 C 3.634 2.82 2.82 3.634 1.817 3.634 C 0.813 3.634 0 2.82 0 1.817 Z" fill="rgb(88, 93, 247)" height="3.633967846768943px" id="E_sZ1ZJZP" transform="translate(57.862 26.217)" width="3.6339678467688827px"/></g></svg>)
How to Calculate, Report, Manage, & Reduce Inventory Aging?
Inventory aging measures the time each SKU stays in stock since it was received or last movement, grouped into aging buckets (0–30, 31–60, 61–90, 90+ days).

Nūl Content Team
An Experienced Research & Knowledge Team
The Nūl Content Team combines expertise in technology, fashion, and supply chain management to deliver clear, practical insights. Guided by Nūl’s mission to end overproduction, we create content that helps brands forecast demand more accurately, optimize inventory, and build sustainable operations. Every piece we publish is grounded in real-world experience, ensuring it’s both credible and actionable.

Table of contents
Inventory aging tells you how long items have been sitting in stock. When products linger, cash gets trapped, warehouses clog up, and the risk of markdowns or write-offs rises. A clear, consistent inventory aging report helps you spot slow movers early, act before value erodes, and align buying, pricing, and marketing with reality.
This guide covers: definitions, formulas (with examples), how to build an inventory aging report (Excel/Sheets or via your systems), and practical tactics to manage and reduce aging inventory.
What Is Inventory Aging?
Inventory aging shows how long each SKU has stayed in stock since it was received or last moved. Items are grouped into time ranges called "aging buckets", usually 0–30, 31–60, 61–90, and 90+ days to highlight which products are slow-moving or at risk of becoming obsolete.
Related terms:
Inventory aging (or aging inventory): Focuses on SKU-level stock duration and uses bucketed data to trigger operational actions such as inventory replenishment, markdown strategies, or transfers.
Average age of inventory (AAI): A single number estimating how many days, on average, items stay in stock (portfolio-level).
Inventory turnover: How many times you sell through your average inventory in a period.
They’re linked mathematically:
Inventory Turnover =
COGS / Average InventoryDays Inventory Outstanding (DIO) (≈ average age) =
365 / Inventory TurnoverAverage Age of Inventory (AAI) ≈
Average Inventory / COGS * 365
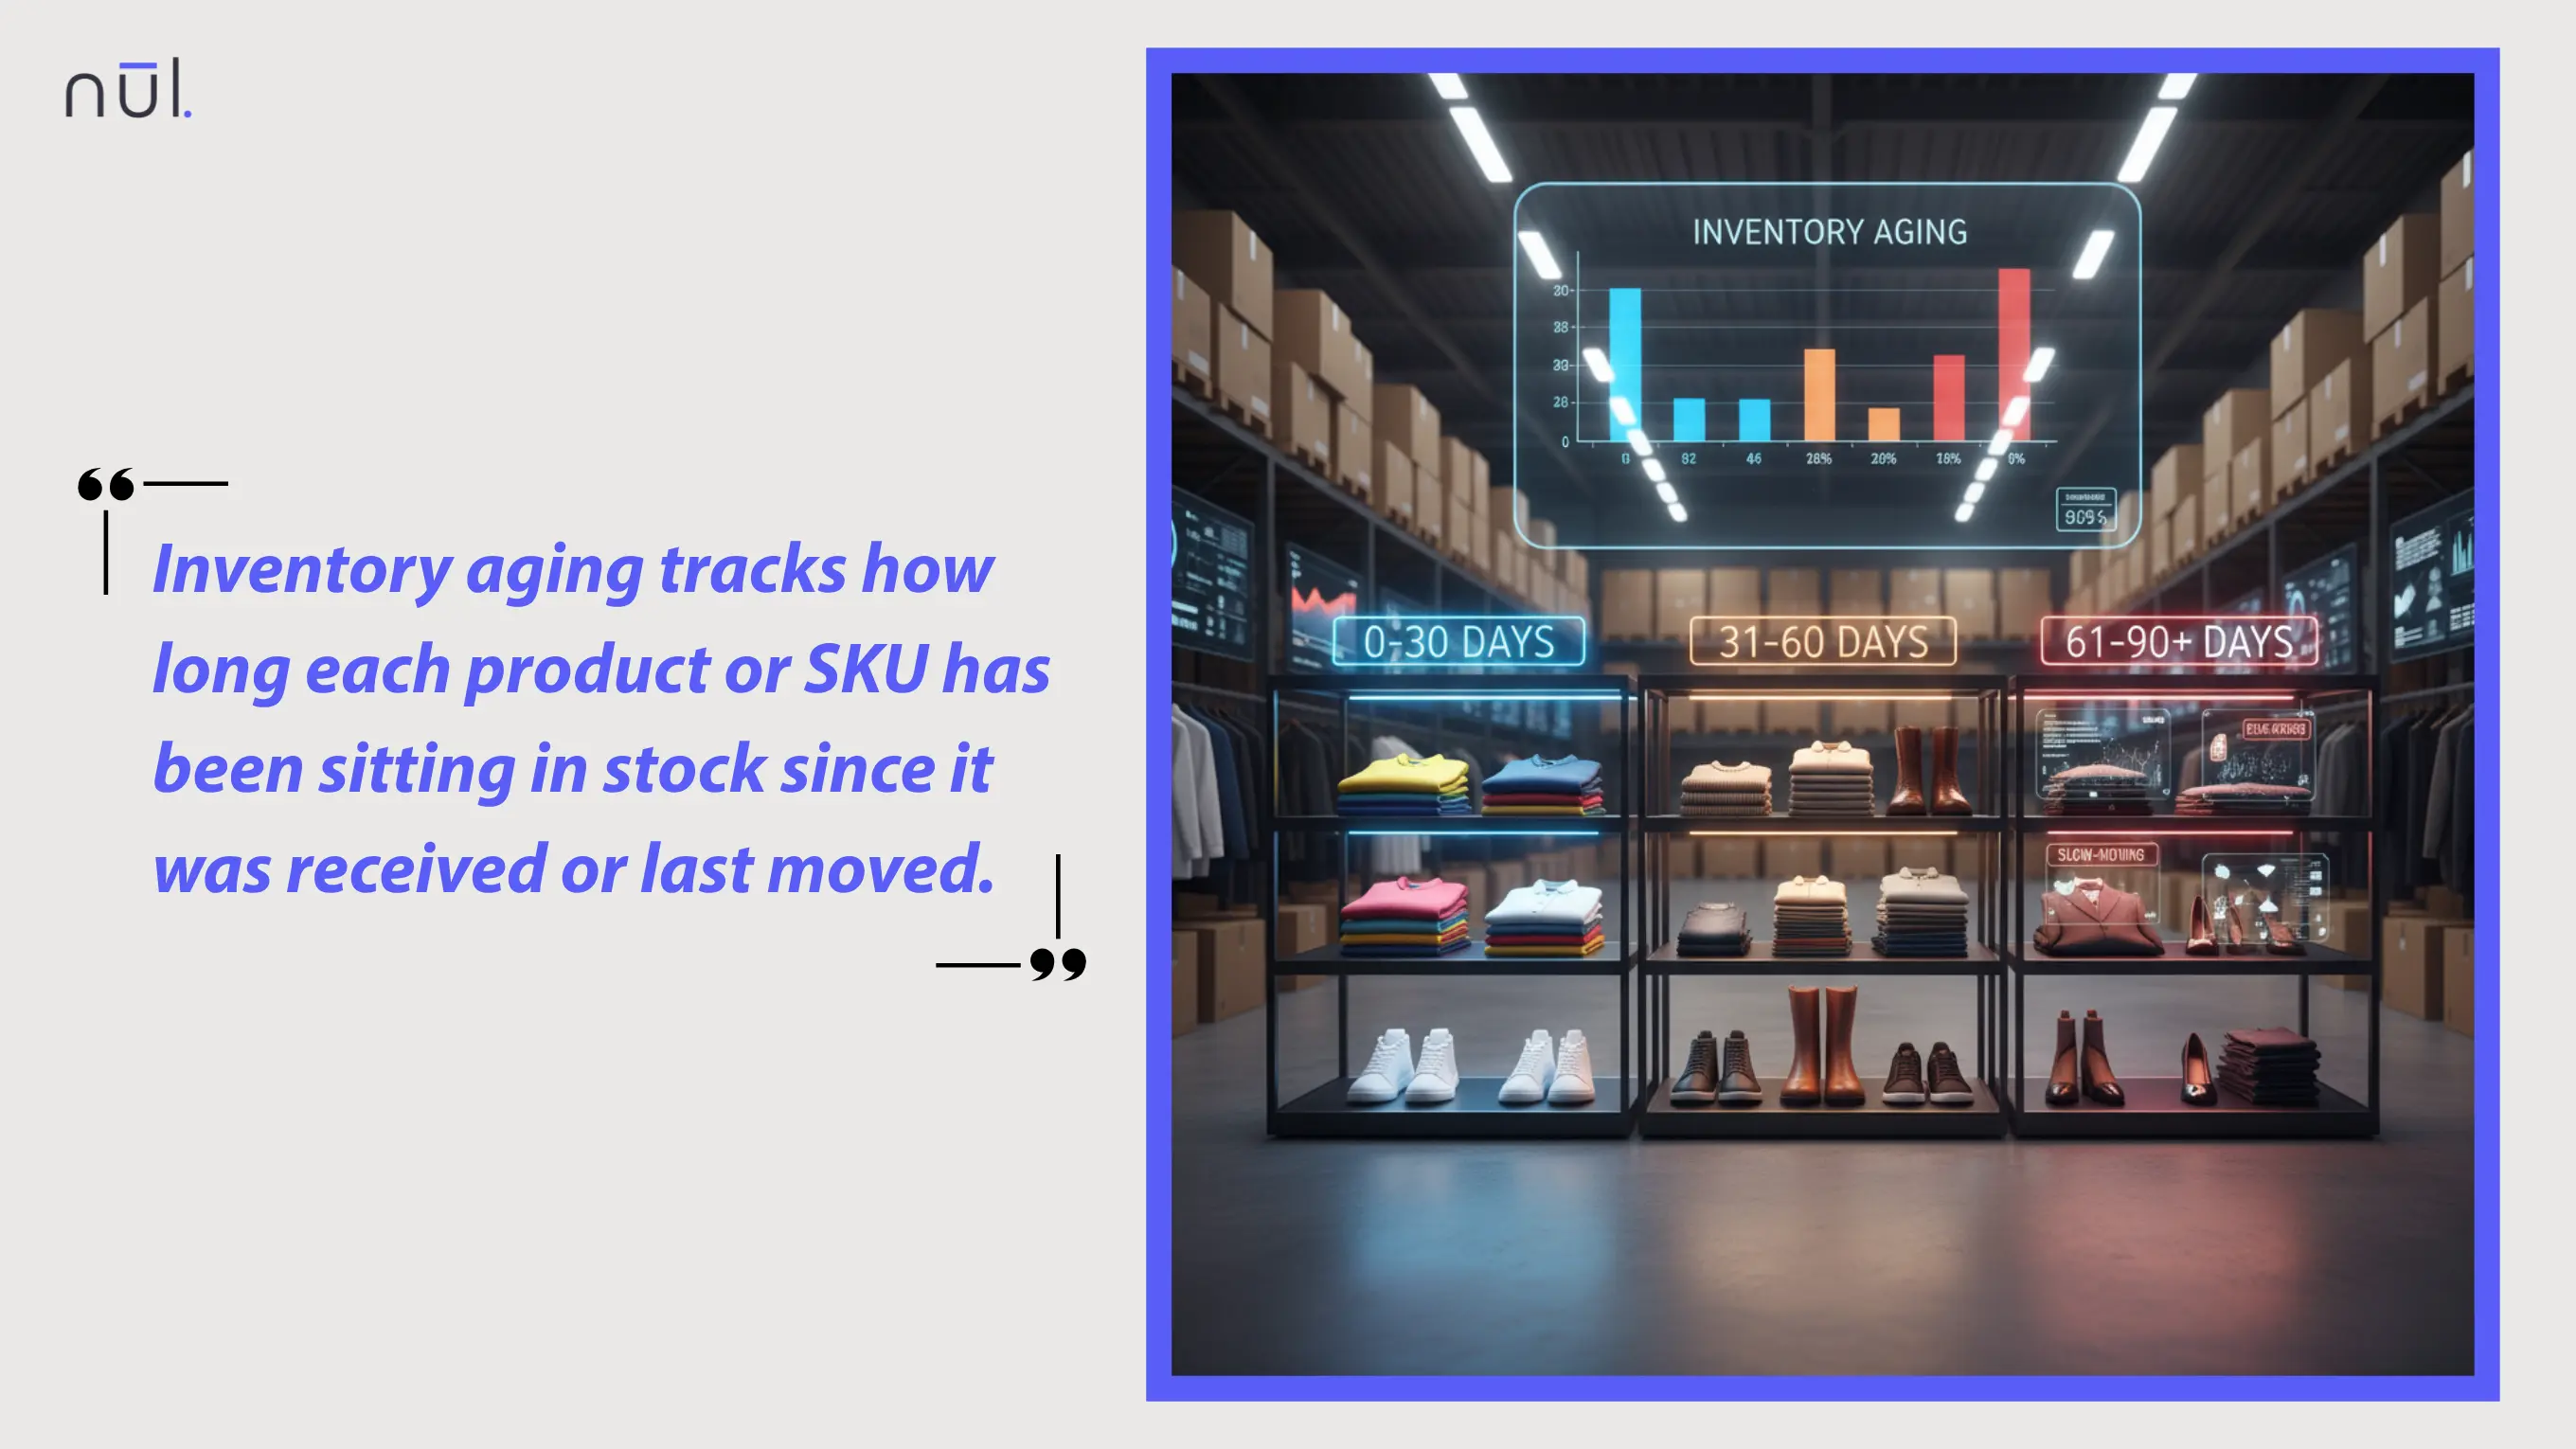
Inventory aging shows how long each SKU has stayed in stock.
Why Inventory Aging Matters?
Cash flow: Excess or old stock locks up working capital that could be used for new products or business growth.
Operational efficiency: Aged items take up valuable warehouse space and increase storage, handling, and maintenance costs.
Profitability: The longer inventory sits unsold, the greater the risk of markdowns, obsolescence, or loss — all of which reduce margins.
Common Causes of Aging Inventory
Poor demand forecasting / overbuying: Forecasts that overlook market trends, seasonality, or recent sales data often lead to poor planning. Businesses may order too much stock or bring in the wrong mix of products because projections don’t reflect actual customer demand.
Long lead times / high MOQs: When suppliers take too long to deliver, orders must be placed far in advance. This early purchasing increases the risk that products will sit longer than expected, especially if demand shifts before the shipment arrives.
Lifecycle mismatches: When products arrive after their planned launch or seasonal window, they surly lose momentum. Also, that new collections come too soon can make existing lines feel outdated. This overlap between old and new products shortens the selling period and leaves earlier batches sitting unsold.
Ineffective pricing & slow marketing: Full-price stubbornness, underpowered campaigns, or misaligned channels slow sell-through. Weak or poorly timed marketing campaigns also reduce visibility and prevent older items from reaching potential buyers.
How to Calculate Inventory Aging?
Formula for Average Age of Inventory (portfolio level):
Two equivalent ways:
Average Age = (Average Inventory / COGS) × 365Average Age = 365 / Inventory Turnover
Where:
Average Inventory =
(Beginning Inventory + Ending Inventory) / 2COGS = Cost of goods sold for the same period.
Example:
Beginning Inventory = $300,000
Ending Inventory = $500,000
→ Average Inventory = $400,000
COGS (year) = $1,200,000
Step 1: Inventory Turnover = 1,200,000 / 400,000 = 3.0×Step 2: Average Age = 365 / 3.0 ≈ 121.7 days (Equivalently: (400,000 / 1,200,000) × 365 = 121.7)
Interpretation: On average, items stay ~122 days before selling. If that’s too high for your category lifecycle, you likely have aging stock issues.
How to Prepare an Inventory Aging Report?
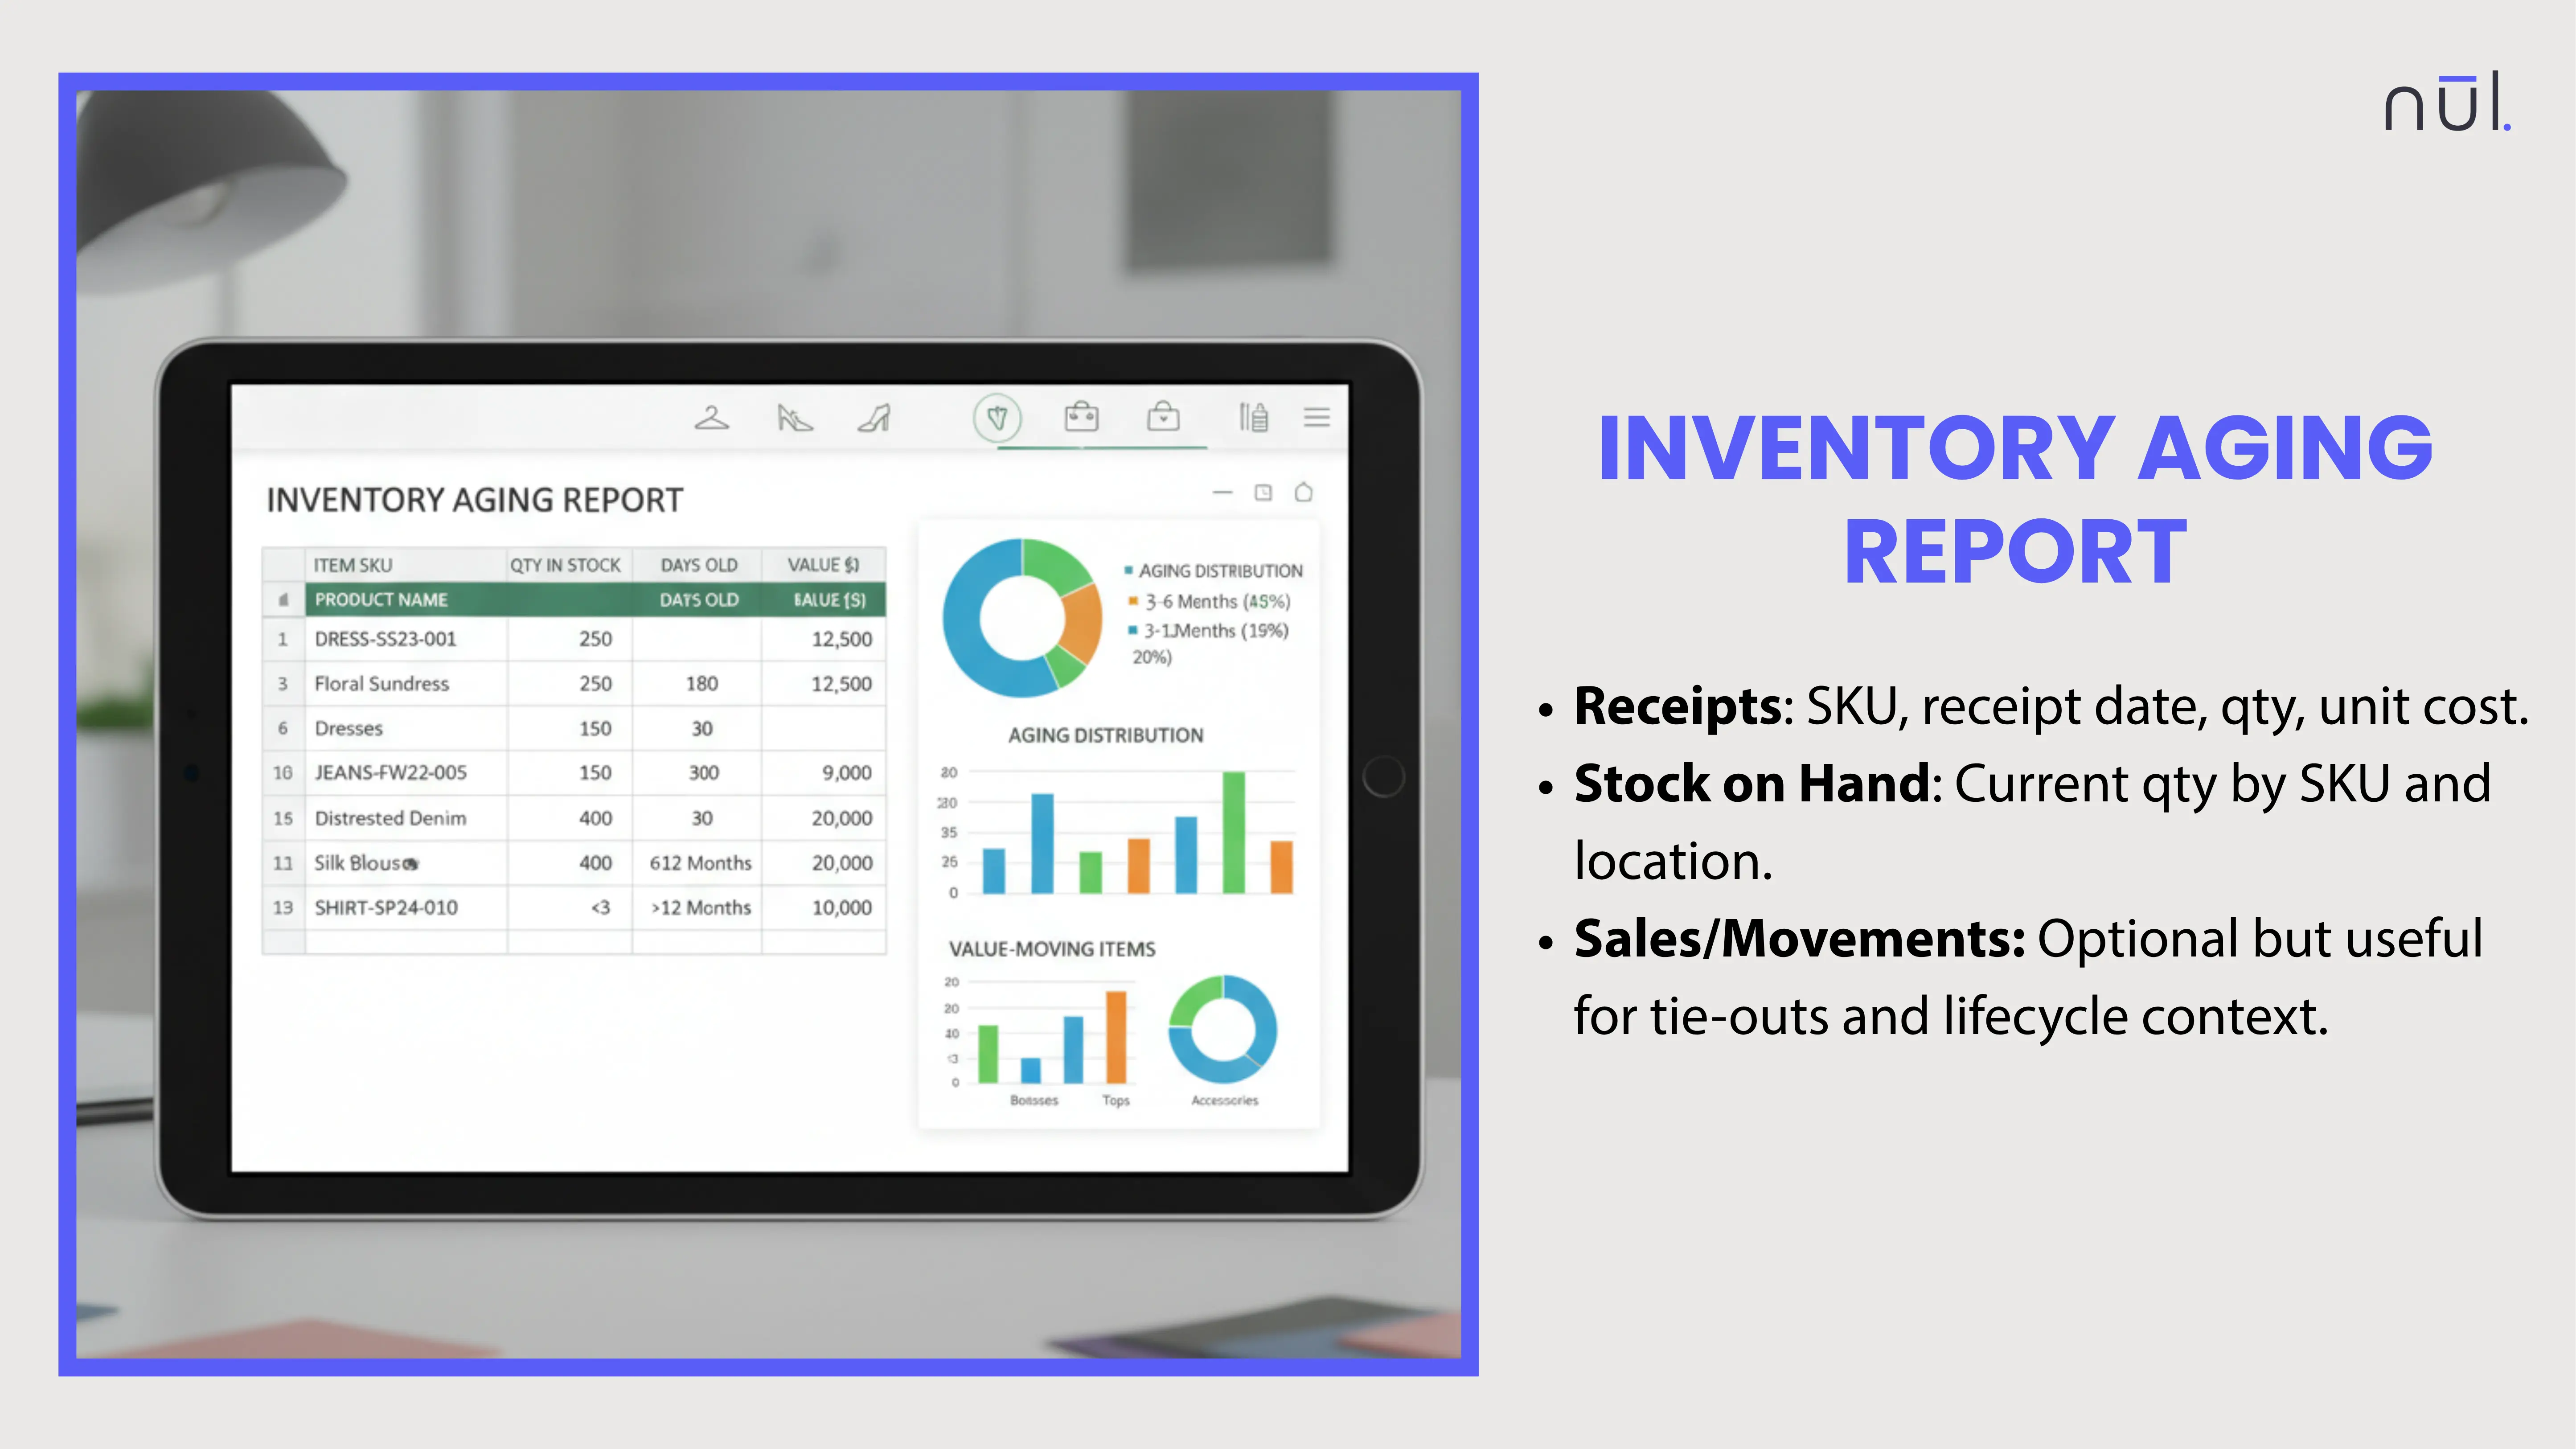
Data you need
Receipts: SKU, receipt date, qty, unit cost.
Stock on Hand: Current qty by SKU and location.
Sales/Movements: Optional but useful for tie-outs and lifecycle context.
Build in Excel or Google Sheets (step-by-step)
Data tab: Combine current on-hand with unit cost and date received (or the oldest receipt date for the remaining qty).
Days on Hand: In Sheets/Excel:
=TODAY() - [Date_Received]Aging Bucket (example using nested IFS in Sheets):
=IFS([Days]<=30, "0–30",[Days]<=60, "31–60",[Days]<=90, "61–90",[Days]<=120, "91–120",TRUE, "120+"Extended Cost:
=[Qty]*[Unit Cost]Pivot Table
Rows: Aging Bucket
Values: Sum of Extended Cost, Count of SKUs
This shows how much inventory value sits in each age group.
Validation checks:
Sum of Ext. Cost ≈ Inventory value in GL (allowing for timing and valuation method).
No negative days or missing receipt dates.
Bucket distribution vs. last month to spot drift.
Build via Systems (Faster & More Reliable)
Most inventory systems include aging reports by default:
ERP/WMS Platforms: SAP, NetSuite, Odoo, and Acumatica offer built-in aging modules that use accurate costing methods like FIFO or Weighted Average.
E-commerce Platforms: You can generate aging data through connected inventory or purchasing apps built for Shopify and WooCommerce.
Advanced Analytics Tools: Platforms such as Nūl, Fishbowl, or inFlow provide SKU-level aging views, combining stock age with attributes like style, color, and location. Some even send automated alerts when items cross specific age thresholds, helping teams take action before value declines.
Inventory Aging Report
How to Manage and Reduce Inventory Aging?
Set Regular Review Intervals: Create an “Aging Standup” (15–30 mins) each week. Review 61–90 and 90+ buckets first.
Improve Demand Forecasting:
Use granular, SKU-channel forecasts that incorporate seasonality, promos, and lead times. Consider using Ai-driven forecasting for better results.
Track forecast error (MAPE/WAPE) and bias; adjust buys accordingly.
Optimize Replenishment Rules
Replace static min/max with dynamic reorder points (lead time × demand + safety stock). Modern replenishment software can automate this process.
Stop auto-replenishing SKUs drifting into 61–90+ buckets.
Implement Inventory Segmentation
ABC by value contribution; XYZ by demand variability.
Tighter controls and smaller MOQs for B/C + Z items to avoid pile-ups.
Enhance Inventory Visibility Across Channels: See store vs. DC vs. online availability in one place; prevent re-ordering while stock is stranded elsewhere.
Use Dynamic Pricing & Promotions
Nudge 31–60 with soft promos; escalate for 61–90; take decisive markdowns at 90+.
Pair with bundles, cross-sells, and influencer/UGC boosts for style-level stories.
Improve Supplier Collaboration
Negotiate lower MOQs, flexible split deliveries, and late-stage color/size allocations.
Share sell-through data to co-plan replenishments.
Reallocate or Transfer Stock: Move inventory to stores/regions with proven demand; surface online if it’s stuck in store (or vice versa).
Establish Clear Disposal / Write-Off Policies
Define when items move from 120+ to liquidation, outlet, donation, or recycling.
Document and review recovery rates quarterly.
Leverage Automation & Analytics
Alerts for bucket thresholds (e.g., when a SKU crosses 60 days with >X units).
Playbooks that auto-suggest actions: promo depth, transfer list, PO cancel/deferral, or liquidation.
Modern AI-driven inventory platforms integrate forecasting, replenishment, and aging analytics to identify risky SKUs early and suggest the highest-impact actions per aging bucket.
>> Read further:
How to Implement AI Agents for Inventory Management Automation?
AI in Fashion Industry: 8 Use Cases, How‑To Guide, Pros & Cons
Batch Production: Examples, Advantages, Disadvantages, & More
Conclusion
Inventory aging is a powerful early-warning system. Start with a clean report (good dates, sound costs, sensible buckets), then build weekly habits to shrink the 61–90 and 90+ segments. Layer in better forecasting, dynamic replenishment, targeted pricing, and smarter supplier terms. You’ll free up cash, protect margins, and keep the assortment fresh.
Want a hands-off way to spot and fix aging inventory? Nūl’s agentic workflows surface risks and recommend actions—before stock goes stale. Reach out and we’ll show you on your data.
Looking for more? Dive into our other articles, updates, and strategies


Let's show you how
