" height="22.21672870003851px" id="z3WvM4hhx" transform="translate(0 7.783)" width="44.5160044463523px"/><path d="M 0 0 L 2.973 0 L 2.973 29.237 L 0 29.237 Z" fill="rgb(51, 51, 65)" height="29.23683002950565px" id="JHCCz3Moo" transform="translate(52.332 0)" width="2.9732091795568465px"/><path d="M 0 0 L 18.335 0 L 18.335 2.973 L 0 2.973 Z" fill="rgb(88, 93, 247)" height="2.9732091795568505px" id="TtL1Ujsfx" transform="translate(26.217 3.072)" width="18.334926489198978px"/><path d="M 0 1.817 C 0 0.813 0.813 0 1.817 0 C 2.82 0 3.634 0.813 3.634 1.817 C 3.634 2.82 2.82 3.634 1.817 3.634 C 0.813 3.634 0 2.82 0 1.817 Z" fill="rgb(88, 93, 247)" height="3.633967846768943px" id="E_sZ1ZJZP" transform="translate(57.862 26.217)" width="3.6339678467688827px"/></g></svg>)
Inventory Velocity: Formula, Example, & How to Improve?
Inventory velocity is the speed at which your inventory is sold or used within a specific period showing how quickly stock moves through the supply chain.

Nūl Content Team
An Experienced Research & Knowledge Team
The Nūl Content Team combines expertise in technology, fashion, and supply chain management to deliver clear, practical insights. Guided by Nūl’s mission to end overproduction, we create content that helps brands forecast demand more accurately, optimize inventory, and build sustainable operations. Every piece we publish is grounded in real-world experience, ensuring it’s both credible and actionable.

Table of contents
Every business runs on movement: products arrive, sell, and make room for the next. Your inventory doesn’t just sit, it moves, cycles, and generates revenue. How fast that happens is what we call inventory velocity.
A healthy inventory velocity means your products are selling quickly enough to free up cash for new collections or restocks. A sluggish velocity signals excess stock, slow-moving SKUs, and cash trapped in your warehouse.
In this article, we’ll break down what inventory velocity really means, how it differs from inventory turnover, the formulas to calculate it, and practical ways to improve it for better efficiency and profitability.
What Is Inventory Velocity?
Inventory velocity is the speed at which your inventory is sold or used within a specific period (usually a month or quarter), showing how quickly stock moves through the supply chain (from raw materials to customer delivery) and converts into revenue.
In simpler terms: Inventory Velocity = How fast inventory becomes revenue.
High velocity = Products sell quickly → healthy cash flow, lower holding costs. However, a velocity that is too high can lead to stockouts if not managed carefully.
Low velocity = Products move slowly → tied-up capital, higher markdowns, and waste.
Example:If you sell through most of your new-season collection within a month, your inventory velocity is high. But if products linger for months, your velocity — and agility — drops.
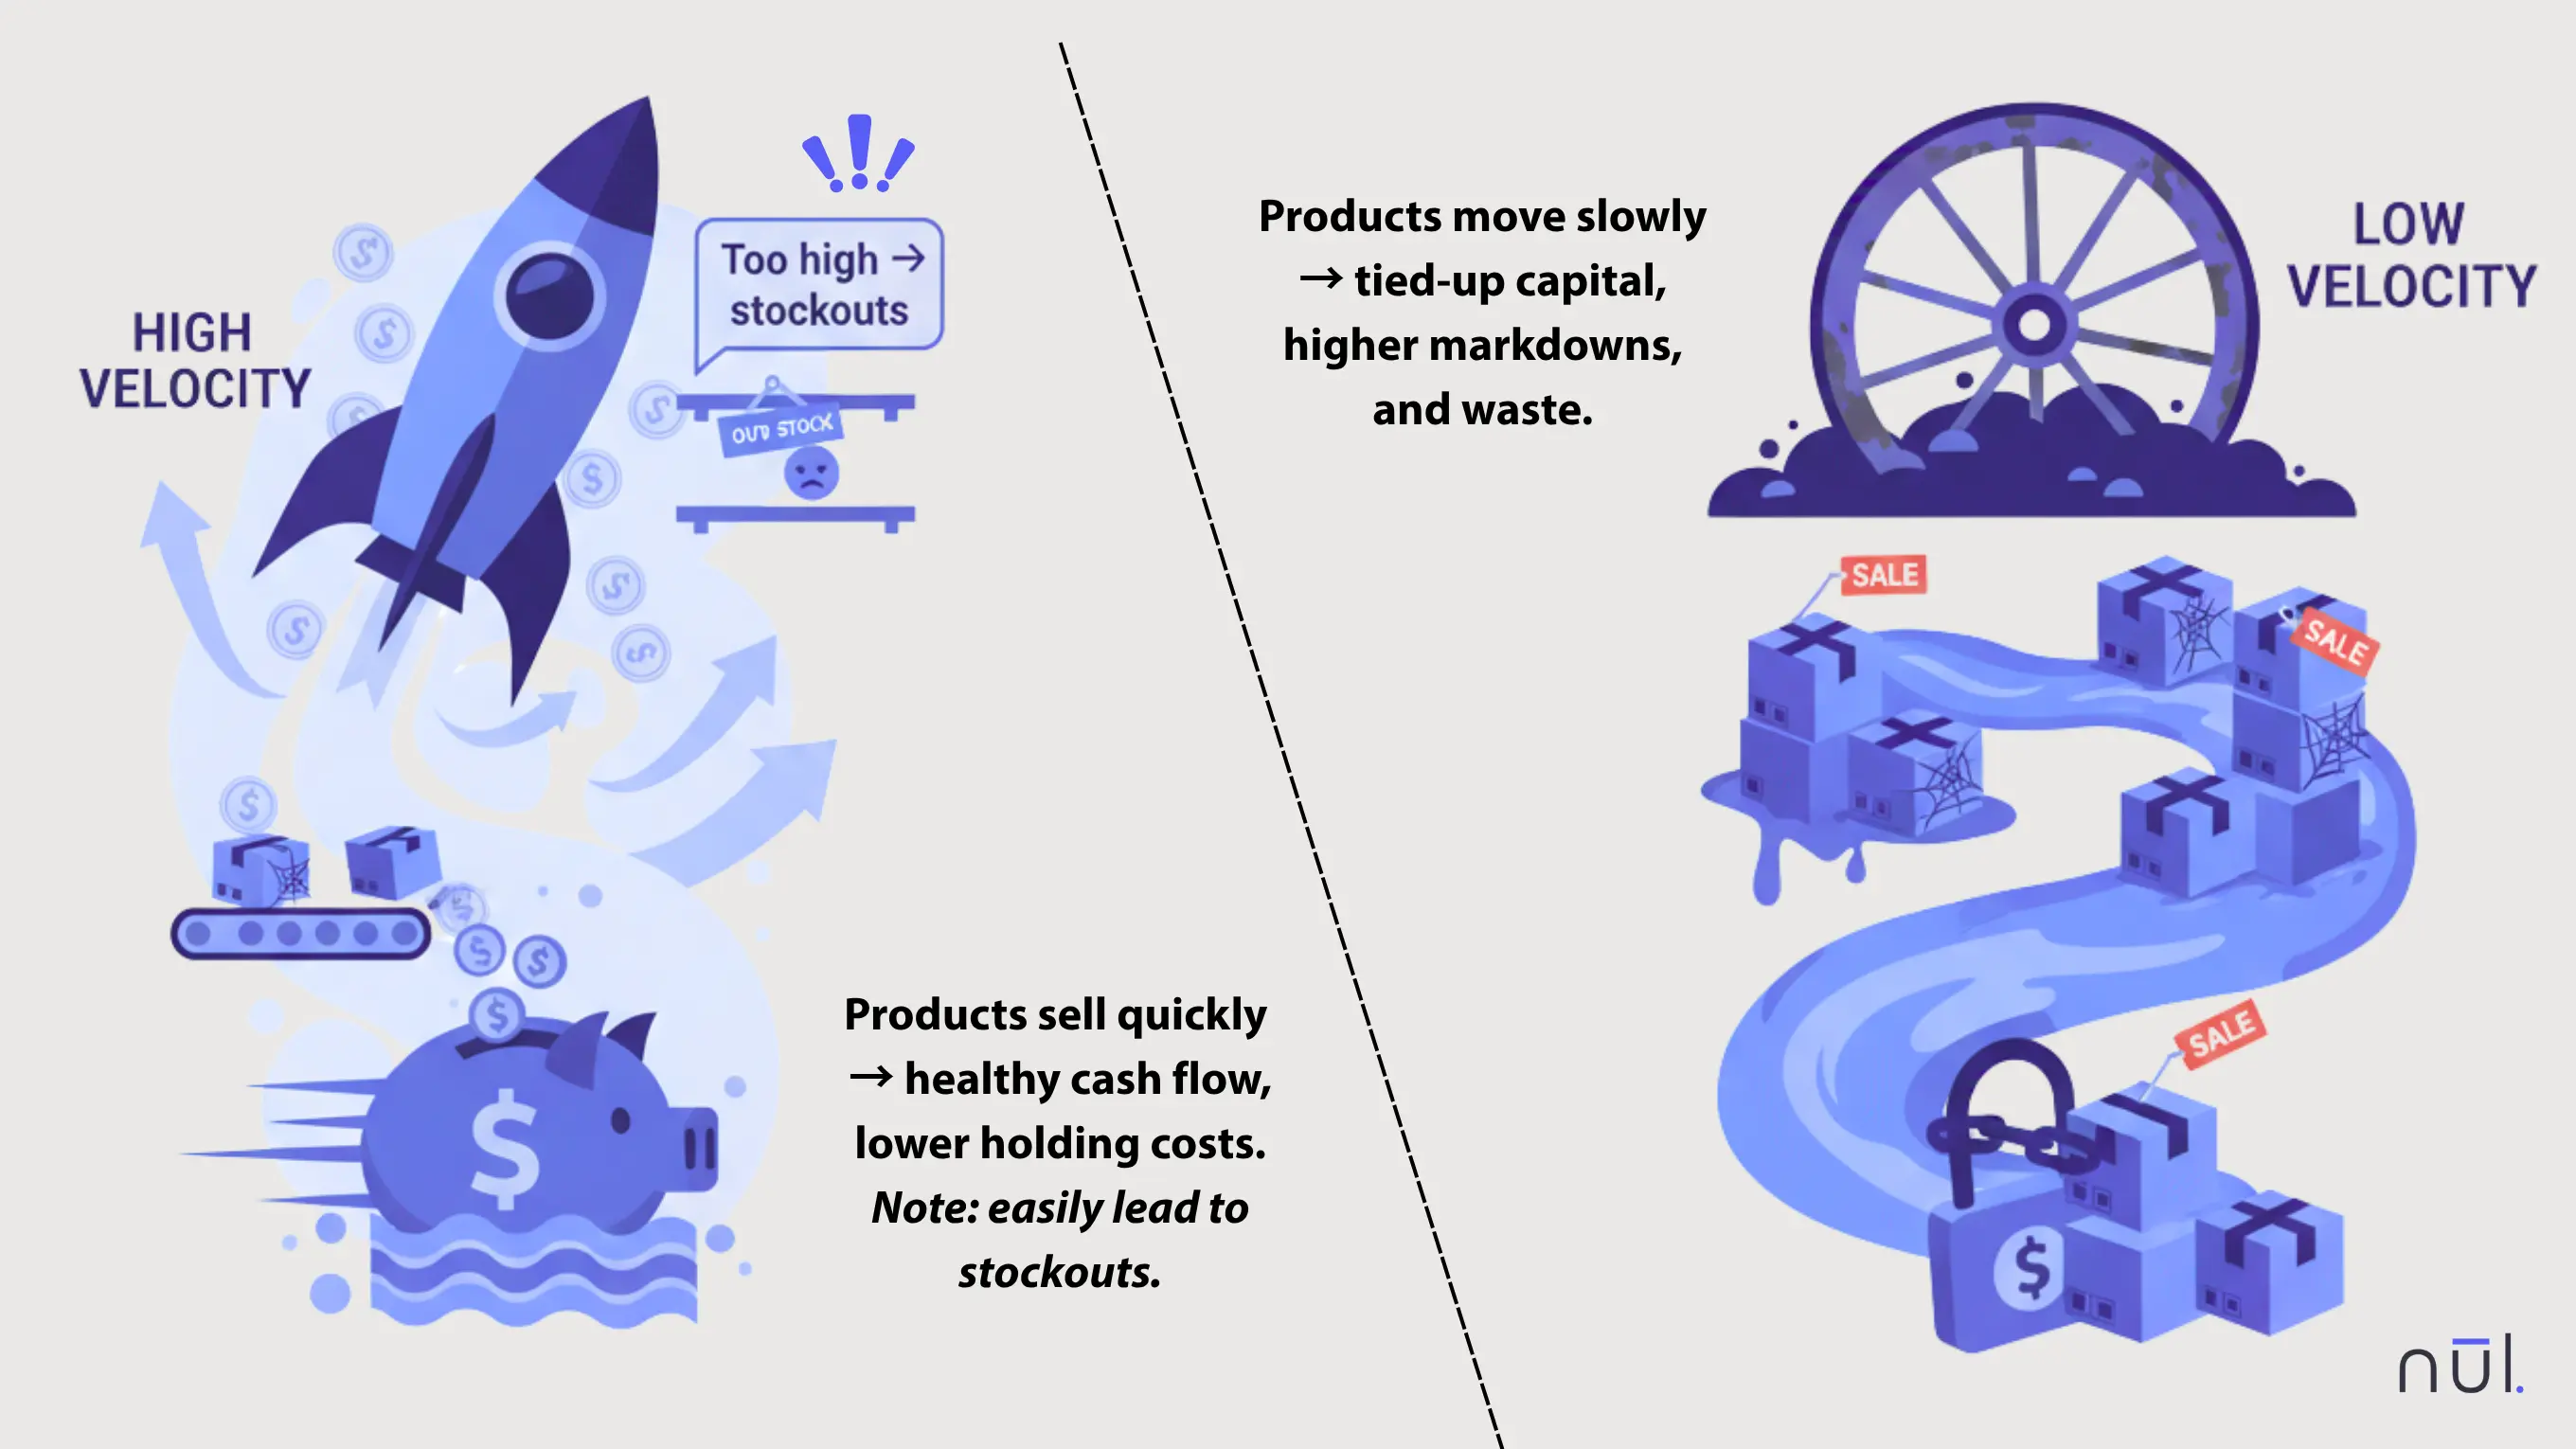
High velocity vs Low velocity.
Inventory Velocity vs. Inventory Turnover
While both measure inventory movement, they differ slightly in focus:
Aspect | Inventory Velocity | Inventory Turnover |
|---|---|---|
Definition | A granular operational metric that tracks how fast specific products or categories move through the supply chain | A high-level financial metric used to measures how many times inventory is sold and replaced in a period. |
Metric Type | Expressed as a percentage or time ratio (e.g., 60% or 30 days). | Expressed as a ratio (e.g., 4x per year). |
Focus | Operational Agility: How long will current stock last, or how quickly is it selling right now? | Financial Efficiency: How well is capital being used over a long period? |
Tracking Frequency | Daily/weekly/monthly monitoring for agility. | Quarterly or annually efficiency analysis. |
Use cases | Used to manage reordering ("We have 15 days of supply left") or run a promotion ("Sell-through is only 20%"). | Used to judge the company's overall health. |
In short, inventory velocity tells you how fast that movement happens, while inventory turnover tells you how many times inventory cycles through sales in a given period
How to Calculate Inventory Velocity?
Inventory velocity can be measured in 2 common ways: one based on cost, the other on units sold. They are used for different purposes, so check it out to choose a suitable approach.
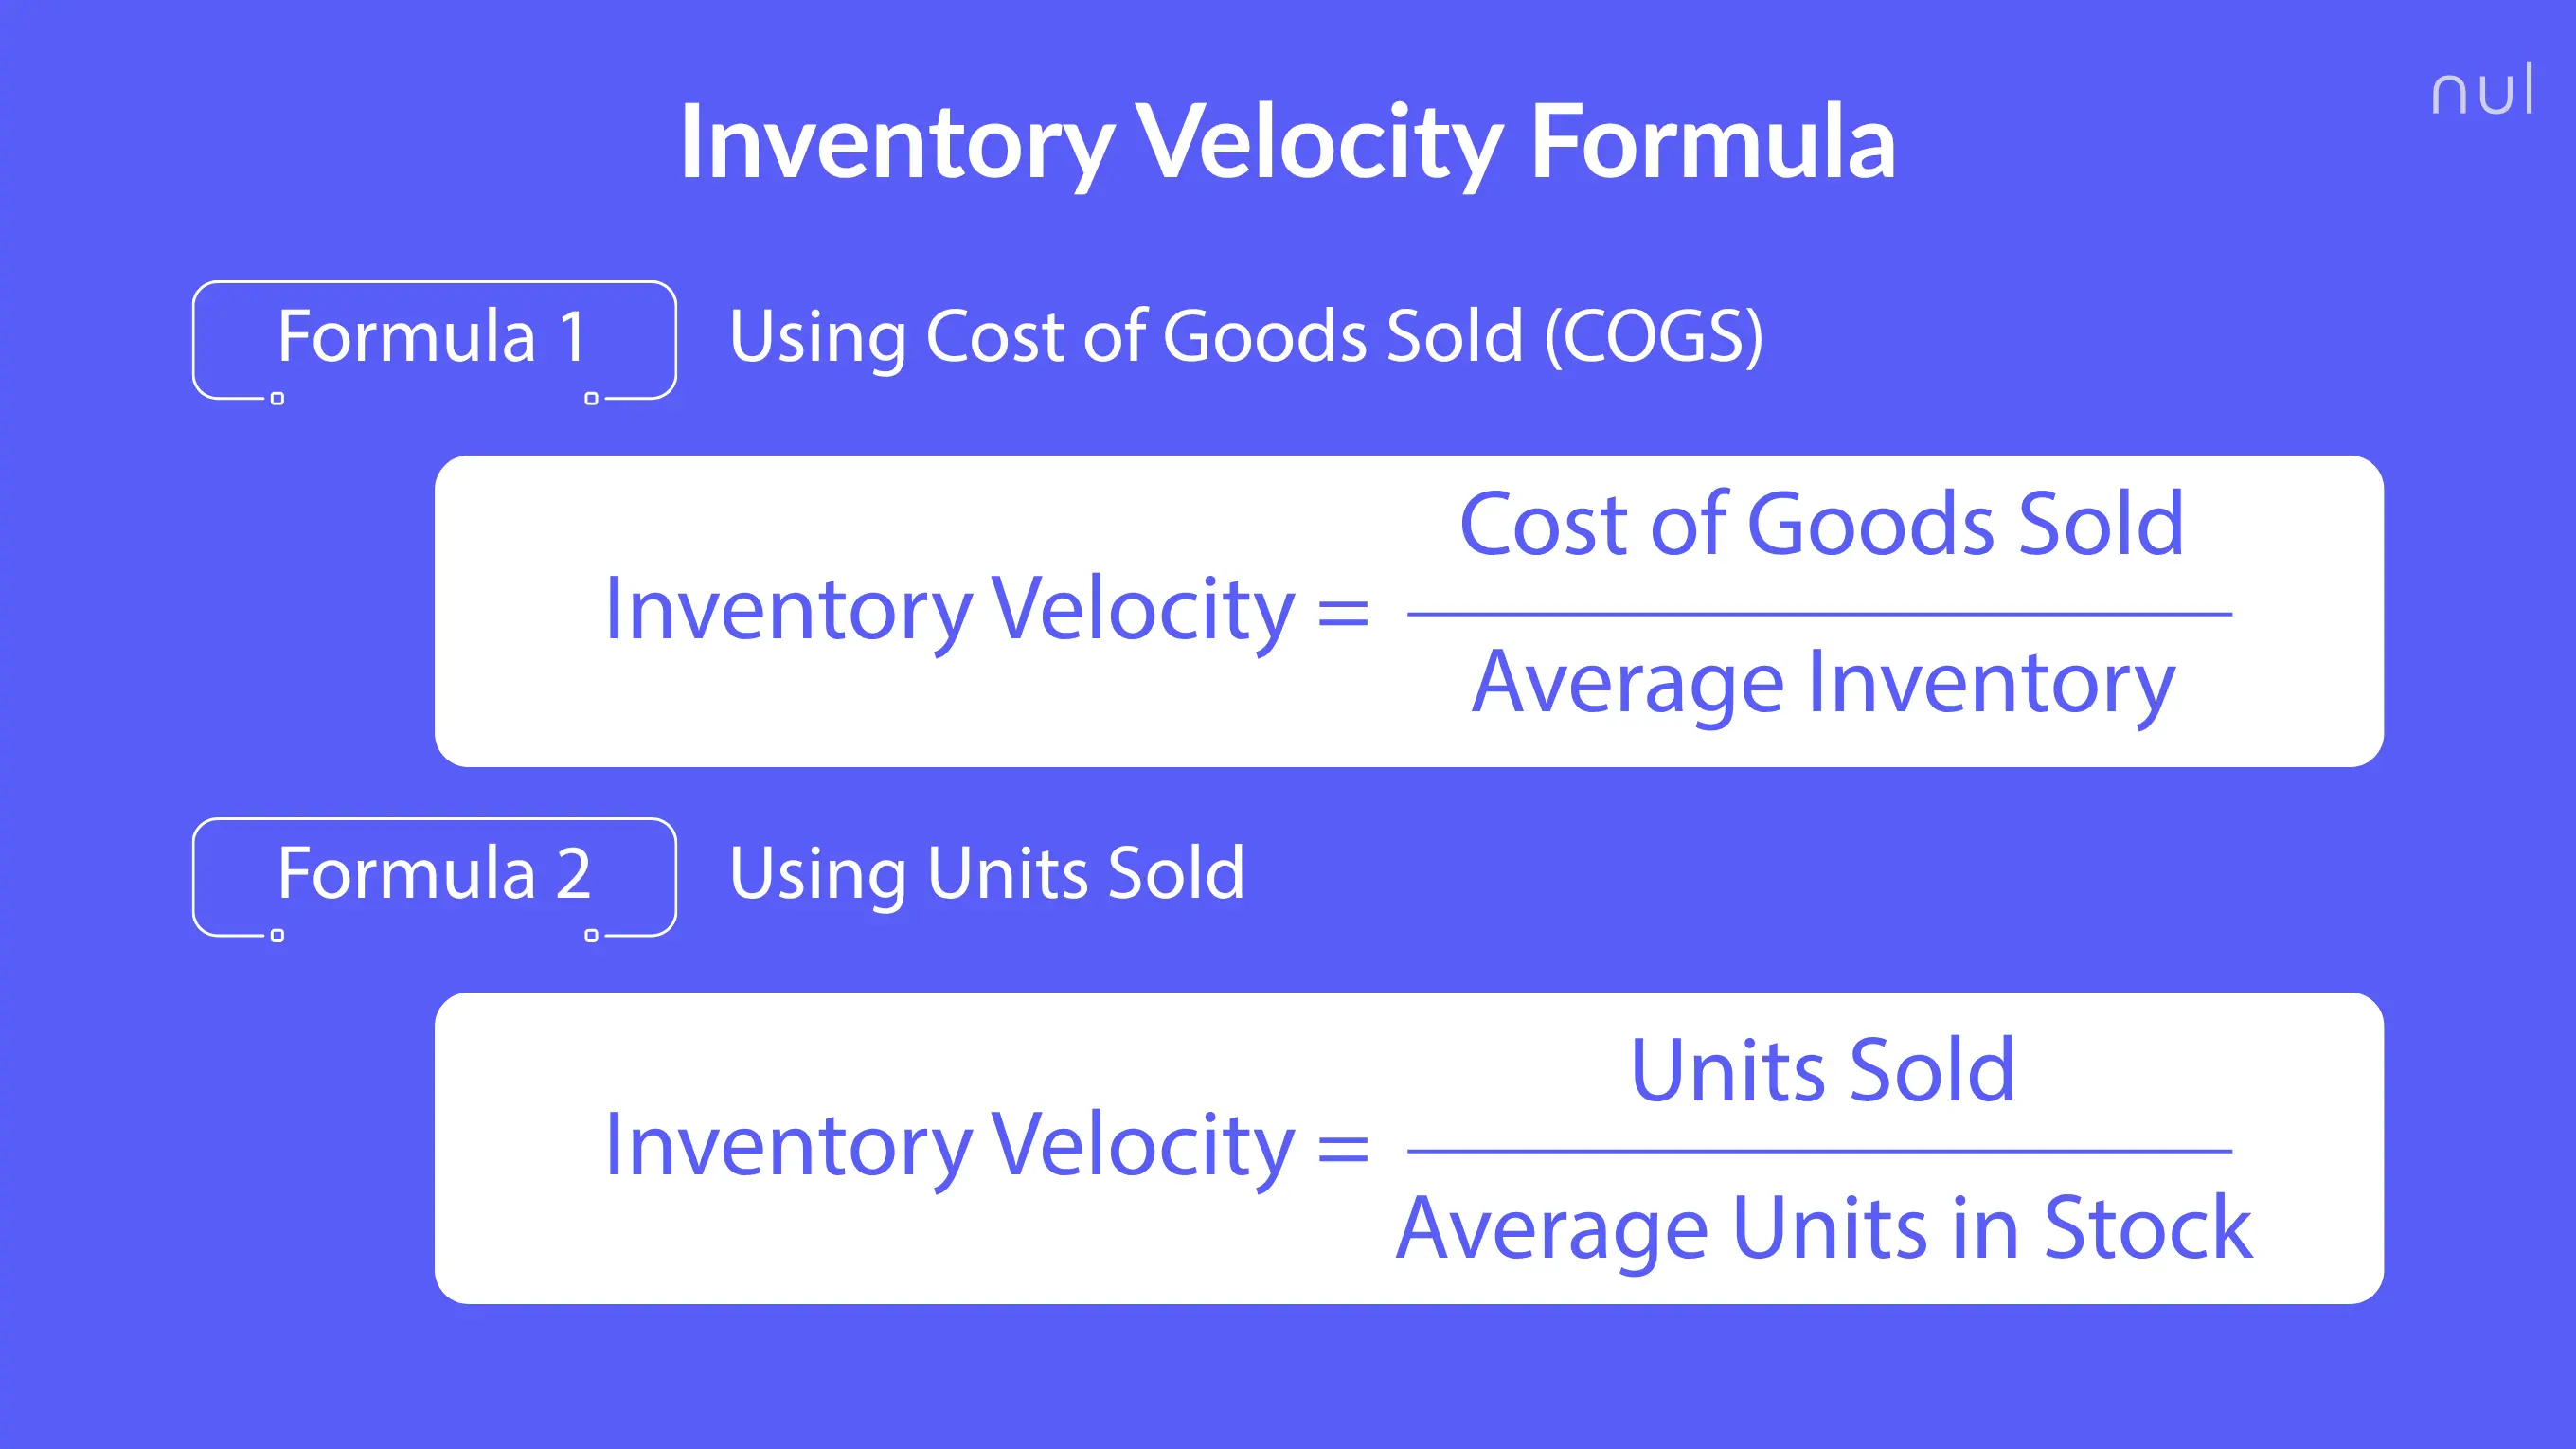
Inventory Velocity Formula 1: Using Cost of Goods Sold (COGS)
Formula:
Inventory Velocity = Cost of Goods Sold / Average Inventory (in dollar terms)
Define each term:
Cost of Goods Sold (COGS): The total cost of producing or purchasing the goods that were sold during a specific period.
Average Inventory: The average value of inventory held during that same period, usually calculated as:
(Beginning Inventory + Ending Inventory) / 2
Example:
If your COGS for the quarter is $500,000 and your average inventory is $125,000, then:
Inventory Velocity = 500,000 / 125,000 = 4
This means your inventory was sold and replaced four times during the quarter.
When to use:
Ideal for financial analysis or cash flow assessment.
Helps understand how efficiently inventory investment converts into revenue.
Best suited for companies tracking inventory in monetary value rather than units.
Inventory Velocity Formula 2: Using Units Sold
Formula:
Inventory Velocity = Units Sold / Average Units in Stock (in unit terms)
Define each term:
Units Sold: The total number of items sold in a given period.
Average Units in Stock: The average quantity of units available during that time, usually calculated as:
(Units at Start + Units at End) / 2
Example:
If you sold 10,000 units of a product in a quarter and kept an average of 2,500 units in stock:
Inventory Velocity = 10,000 / 2,500 = 4
Your inventory turns over four times during the period, meaning each unit stays in stock for about three months before being sold.
When to use:
Ideal for SKU-level tracking or warehouse management.
Helpful when COGS data isn’t easily available but unit sales are.
Useful for analyzing the physical movement of inventory in retail or manufacturing environments.
Actually, both formulas lead to the same insight, but they do it from different perspectives: one in dollars, the other in units. Consider your use cases to pick a suitable one.
How to Calculate Inventory Velocity?
Why Inventory Velocity Matters in Business?
A strong inventory velocity directly influences nearly every aspect of retail operations:
Frees Up Cash Faster: Fast-moving inventory converts stock into cash quickly, allowing reinvestment in new styles, marketing, or inventory replenishment. This keeps working capital active instead of locked in unsold goods.
Lowers Storage Costs: When inventory moves steadily, products spend less time in warehouses. This lowers expenses related to storage, insurance, handling, and potential damage. It also helps avoid markdowns caused by aging inventory or excess stock.
Forecasts Demand Better: Tracking inventory velocity provides real sales data that increases forecasting accuracy. Businesses can identify top-performing items, spot seasonal trends early, and adjust purchase plans before overstocking or running out.
Reflects Business Health: A consistently strong inventory velocity indicates balanced demand, efficient operations, and responsive management. It signals that the business can adapt quickly to market changes and sustain steady growth.
How To Improve Inventory Velocity?
Whether you’re a retailer, wholesaler, or brand managing multiple channels, improving velocity means aligning demand, supply, and data. Here’s how:
Forecast and Plan Demand Accurately
Use reliable forecasting tools or AI-powered models (such as Nūl’s forecasting agent) to align purchase orders and production with real demand. Accurate forecasts reduce overstocking, prevent stockouts, and keep inventory moving steadily. Regularly review historical sales, seasonality, and promotion data to refine future plans.
Rationalize Your SKU Mix
Analyze product performance for specific SKUs. Focus resources on high-bestsellers items that drive revenue and reduce those that move slowly. Better inventory assortment improves average inventory velocity and simplifies restocking decisions.
Strengthen Supplier Collaboration
Build closer relationships with suppliers to improve communication, visibility, and lead-time flexibility. Sharing sales data and forecast updates allows suppliers to plan production more efficiently, ensuring timely replenishment without overstock. The shorter and more reliable the supply cycle, the faster inventory can flow.
Automate Replenishment Decisions
Use software that automatically triggers purchase orders or restocks based on real-time sales velocity and inventory thresholds. This data-driven approach maintains consistent product availability, minimizes manual errors, and ensures faster response to demand spikes or slowdowns.
>> Explore further: 10 Best Inventory Replenishment Software Solutions
Optimize Warehouse Operations
Improve how inventory moves within your warehouse to speed up fulfillment. Organize high-demand products closer to packing stations, use barcode tracking for accuracy, and review picking routes to cut down wasted time. Faster internal processes directly contribute to higher inventory velocity.
Conclusion
Inventory velocity is more than a formula — it’s a reflection of how responsive and agile your business truly is.
A strong velocity keeps cash flowing, products relevant, and customers happy. A slow one points to missed opportunities, inefficiencies, and hidden costs.
Take time to calculate your velocity, identify where slowdowns occur, and implement data-driven improvements. With adaptive AI systems, brands can track, forecast, and optimize inventory velocity in real time — keeping every collection in sync with actual market movement.
Faster velocity. Smarter inventory. Zero waste.
Looking for more? Dive into our other articles, updates, and strategies


Let's show you how
