" height="22.21672870003851px" id="z3WvM4hhx" transform="translate(0 7.783)" width="44.5160044463523px"/><path d="M 0 0 L 2.973 0 L 2.973 29.237 L 0 29.237 Z" fill="rgb(51, 51, 65)" height="29.23683002950565px" id="JHCCz3Moo" transform="translate(52.332 0)" width="2.9732091795568465px"/><path d="M 0 0 L 18.335 0 L 18.335 2.973 L 0 2.973 Z" fill="rgb(88, 93, 247)" height="2.9732091795568505px" id="TtL1Ujsfx" transform="translate(26.217 3.072)" width="18.334926489198978px"/><path d="M 0 1.817 C 0 0.813 0.813 0 1.817 0 C 2.82 0 3.634 0.813 3.634 1.817 C 3.634 2.82 2.82 3.634 1.817 3.634 C 0.813 3.634 0 2.82 0 1.817 Z" fill="rgb(88, 93, 247)" height="3.633967846768943px" id="E_sZ1ZJZP" transform="translate(57.862 26.217)" width="3.6339678467688827px"/></g></svg>)
What is Deadstock in Fashion? Causes, Problems, Solutions
Deadstock in fashion is finished merchandise or unused fabric that remains unsold past its intended selling window, tying up capital, storage space, and margin.

Nūl Content Team
An Experienced Research & Knowledge Team
The Nūl Content Team combines expertise in technology, fashion, and supply chain management to deliver clear, practical insights. Guided by Nūl’s mission to end overproduction, we create content that helps brands forecast demand more accurately, optimize inventory, and build sustainable operations. Every piece we publish is grounded in real-world experience, ensuring it’s both credible and actionable.

Table of contents
Deadstock, which is unsellable finished merchandise or unused fabric, become one of the clearest signs of the fashion industry’s overproduction problem. Some deadstock causes are over ordering, missed trends, and ended seasons with unsold stock.
In 2026, faster trend cycles, stricter regulation, and higher inventory costs are making deadstock harder to ignore. Brands can no longer rely on quiet discounting, long-term storage, or destruction as easy exit routes.
This guide covers what deadstock means, how to measure it with a formula, why it happens even to well-run brands, practical ways to prevent it, and a decision matrix for moving it when it already does.
KEY TAKEAWAYS:
|
What does Deadstock Mean in Fashion?
Deadstock in fashion is finished merchandise or unused fabric that remains unsold past its intended selling window, tying up capital, storage space, and margin.
In inventory-management language, deadstock is stock with zero (or near-zero) sales velocity over a defined window, usually 90 to 180 days, depending on the category.
The term “deadstock” is used in different ways depending on who is speaking:
retailers and CFOs use it to describe unsold finished goods.
designers use it to describe leftover mill fabric (deadstock fabric), cancelled orders, or unused production runs.
sneaker and streetwear collectors use it to describe new-in-box vintage that never got worn.
All three meanings share one common thread: something was made, and no one bought it.
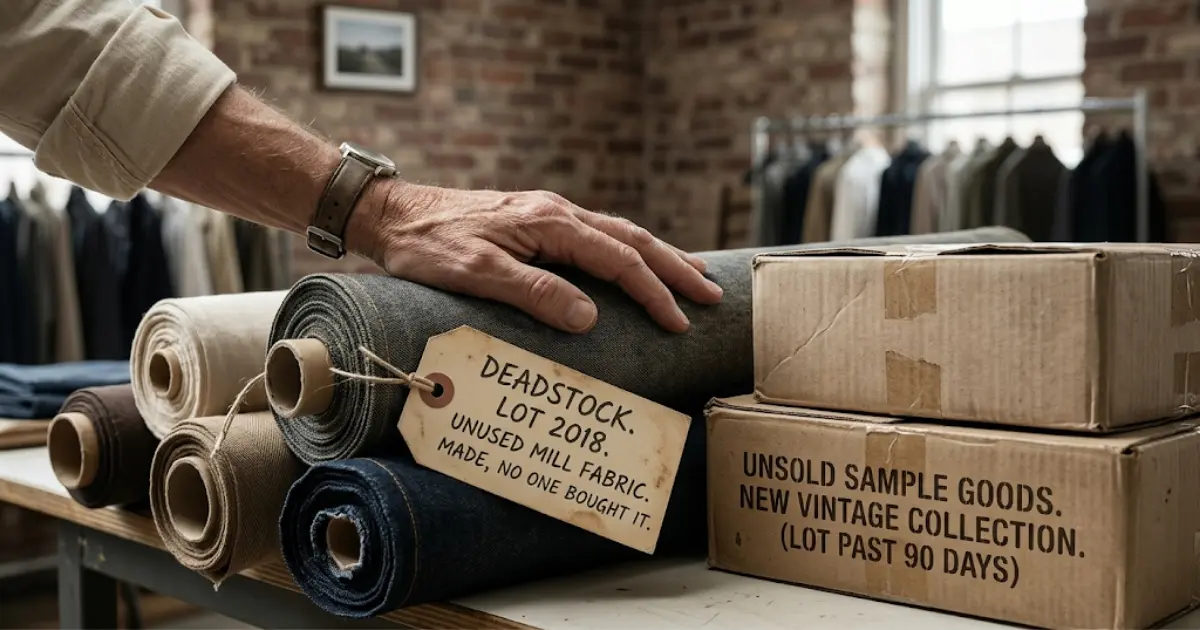
Deadstock in fashion is finished merchandise or unused fabric.
Slow-Moving vs. Deadstock vs. Obsolete Inventory
Slow-moving inventory, deadstock, and obsolete inventory are often used interchangeably, but they are not the same. A good inventory system treats them as separate stages because each one requires a different response.
Term | Sales Velocity | Time on Hand | Status |
Fresh inventory | Selling at or above forecast | 0–30 days | Healthy |
Slow-moving inventory | Selling below forecast, but still moving | 60–120 days | Recoverable with action |
Deadstock | Zero or near-zero sales | 90–180+ days | Needs a clearance, resale, donation, or rework plan |
Obsolete inventory | No realistic future demand | Season expired or product discontinued | Likely write-down or disposal |
The exact line between slow-moving stock and deadstock depends on the product category. For example, a basic T-shirt is still recoverable after 180 days, while a trend-led fast-fashion top can become deadstock in 45 days. What matters is not the exact number, but whether the brand has a clear threshold and monitors it before the end-of-season review.
How to Measure Deadstock: 5 KPIs Fashion Brands Should Track
Deadstock often goes unnoticed because sales, margin, and inventory data are tracked separately. By the time it appears as a write-down, the stock may have been sitting for months or even seasons.
To catch deadstock earlier, brands should track 5 KPIs weekly: deadstock rate, inventory aging, non-moving SKU percentage, weeks of supply, and GMROI (Gross Margin Return on Investment) drag.
Deadstock Rate
Deadstock rate shows what share of your current inventory is no longer generating sales.
Formula:
Deadstock rate = (Units with zero sales in the last N days ÷ Total units on hand) × 100
Set N to the aging threshold for your category, for example:
45 – 60 days for fast fashion tops,
90 for contemporary womenswear,
180 for outerwear or footwear.
A real example: A brand holds 200,000 units across all SKUs; 24,000 have not sold a piece in 90 days => Deadstock rate = 12%.
Inventory Aging Buckets
Inventory aging shows how long stock has been sitting in the business. It helps teams separate healthy inventory from slow-moving and deadstock items.
Age Bucket | Meaning | Typical Action |
0–30 days | Fresh inventory | Sell at full price |
31–60 days | Active season stock | |
61–90 days | Watchlist | Test first markdowns or merchandising changes |
91–180 days | At-risk stock / early deadstock | Use stronger markdowns, outlet, bundles, or channel moves |
180+ days | Confirmed deadstock | Liquidate, donate, upcycle, recycle, return to vendor, or write down |
If too much inventory sits in the 91–180 day and 180+ day buckets, deadstock is already affecting working capital, margin, and next-season buying decisions.
Non-Moving SKU Percentage
Deadstock rate measures dead units. Non-moving SKU percentage measures how much of the assortment is not selling. The second number is often much worse than the first.
Formula:
Non-moving SKU % = (SKUs with zero sales in the last N days ÷ Total active SKUs) × 100
This number matters because a brand has a manageable deadstock rate by unit count, but still carries too many non-selling SKUs.
In a typical fashion assortment, 20% of SKUs generate 70 to 80 percent of revenue. That means a brand can post a 10% deadstock rate on units while carrying 30 – 40% non-moving SKUs. This causes a bloated catalog dragging on planner attention, photography budget, and warehouse pick paths.
If the non-moving SKU percentage is high, the solution is SKU optimization, not more markdown strategies.
Weeks of Supply on Slow Movers
Weeks of supply tells you how long the current stock will last at current velocity. It's a healthy metric on fast-movers (you want 6 to 12 weeks). On slow-movers, it turns into a countdown to write-down.
Formula:
Weeks of supply = Units on hand ÷ Average weekly sales
This metric is used to filter slow-moving SKUs, especially items in the 61–90 day and 91–180 day buckets. If a slow-moving product has too many weeks of supply left, the current sales plan is not working. At that point, the brand needs deeper markdowns, outlet placement, bundling, resale, or another channel strategy.
GMROI Drag
GMROI shows how much gross margin the brand earns for every dollar invested in inventory.
Formula:
GMROI = Gross margin ÷ Average inventory cost
Deadstock damages GMROI in two ways:
Increases average inventory cost because unsold products remain on the books
Contributes little or no gross margin because the products are not selling.
For example: a brand runs a healthy GMROI of 3.0 on its full assortment. Isolate the same brand's non-deadstock SKUs and GMROI is actually 4.1, so the deadstock is dragging the reported number down by 27 percent. The healthy SKUs are performing better than the dashboard shows, but the deadstock is underrating the whole assortment.
A useful diagnostic is the GMROI gap: Compare GMROI for the full assortment against GMROI after removing 180+ day deadstock SKUs. If the gap is large, deadstock is not just a storage issue. It is reducing the brand’s overall inventory productivity.
8 Root Causes of Deadstock in Fashion
Deadstock is rarely the result of one bad decision. It builds up from small forecasting, buying, and operational mistakes across a season.
Most causes fall into three groups: the buy was wrong (planning-side), demand changed after the buy (market-side), and the stock existed but couldn't reach the right channel in time (operations-side).
Overproduction and safety-stock inflation
Overproduction is the most common cause, and usually the most expensive. Brands over-order to avoid stockouts, and every buyer along the chain adds a safety cushion of their own.
By the time the purchase orders (PO) reaches the mill, the safe order is 20 to 40 percent above forecast, and any forecast miss on the downside lands directly in the deadstock pile.
Global apparel is estimated to produce 20 to 30 percent more units than the market absorbs, up to 30 billion pieces a year that never sell. Overproduction isn't a rare failure mode, but the industry's baseline setting.
Forecast error on new SKUs (the cold-start problem)
New products have no sales history, so forecasts rely on analogs, instinct, or last year's style. The error rate on new-SKU forecasts is much higher than on repeat products and fashion assortments turn over 40 to 60 percent of SKUs each season.
A brand launching 200 new styles each drop is placing 200 bets with weak evidence, and the losing bets become deadstock.
Wrong color and size curve at allocation
A style can post healthy overall sell-through while specific size or color variants sit unsold. Some mistakes we can face:
XL and 3XL sizes get over-bought because the size curve was based on volume assumptions rather than actual regional demand.
Pastel colorways get allocated evenly across stores when they only sell in specific markets.
Thus, a style running at 50 percent sell-through can hide XL and pastel variants at zero percent sell-through. Those unsellable variants will become deadstock even while the style gets called a win. Deadstock at the SKU level is invisible if you only track at the style level.
Trend collapse mid-season
Fashion trend cycles compress every year. A print or silhouette that felt safe when the buy was placed in September can totally be dead by March. Besides, TikTok-driven micro-trends can rise and die inside a single quarter, leaving brands holding stock of a look nobody wants photographed anymore.
Trend collapse hits contemporary and fast-fashion brands hardest, where buying decisions are often made months before the customer actually sees the product. The gap between "we bought this six months ago" and "this trend peaked last month" is where deadstock lives.
Fast-fashion cycle time compression
Fast-fashion cycle times have collapsed from six months to as short as three weeks in some categories. The upside is agility. The downside is that a brand running 20+ drops a year is placing 20+ forecast bets a year, each with a small window to sell through before the next drop takes shelf space.
Every drop that isn't clear on schedule becomes carryover, and carryover across two or three drops becomes deadstock. The compressed cycle multiplies the number of deadstock decisions a planner has to make, without multiplying the time to make them.
Poor sell-through visibility across channels
A brand can be sold out of a style in one store and drowning in it in another. Without unified inventory visibility across retail, ecommerce, wholesale, and marketplace channels, planners can't spot the imbalance in time to trigger transfers. The stock that should have moved sits in the wrong location until the season closes.
Roughly 44% of fashion retailers report excess stock (source: sciencedirect), and the cause is often not overordering, it's overordering in the wrong place.
Returns not restocked in time
Ecommerce return rates in apparel run 20 to 30% which is three to four times higher than physical retail. Returned units that take three or four weeks to work back through reverse logistics often re-enter inventory after the peak selling window for that style has closed. The unit is technically "on hand" but arrives too late to sell at full price.
The problem is worst on seasonal and trend items, where a two-week reverse-logistics lag can be the difference between selling and marking down.
Broken replenishment loops
Automated replenishment systems can be a deadstock generator when they aren't wired correctly. A rule that says "reorder when stock drops below X" will keep reordering slow-movers as long as any sales come in. The result is a slow accumulation of the same underperforming SKU across multiple replenishment cycles.
The better approach is to factor in sales velocity and projected weeks of supply. If demand is too weak to clear the next order, replenishment should stop even if the stock level looks low.
The Real Cost of Deadstock
Fashion executives know deadstock is expensive. Most don't know how expensive because the cost hides in five places:
Cost Line | Annual Impact |
Carrying cost (20–25% of value) | $2.0M – $2.5M |
Opportunity cost of capital (7% assumed) | $700K |
GMROI drag on remaining assortment | $500K – $1M |
Eventual write-down (60–80% of value, one-time) | $6M – $8M |
Regulatory and reporting cost | Variable, rising |
Brand and ESG impact | Variable, rising |
Carrying costs:
Every unit in the warehouse burns storage, insurance, capital interest, WMS licensing, and cycle-count labor. Total carrying cost runs roughly 20 to 25 percent of an item's landed value per year.
A brand sitting on $500,000 of deadstock burns $100,000 to $125,000 annually just to hold it before any markdown.
Opportunity cost:
Every dollar frozen in deadstock is a dollar not funding the SKUs that actually sell. In a 7 to 9 percent rate environment, holding $1 million of deadstock costs $70,000 to $90,000 a year in unearned capital. If your best SKUs return a GMROI of 4.0, each trapped dollar is also four dollars in gross margin not earned elsewhere.
Write-downs on the P&L (Profit and Loss):
Under IFRS and US GAAP, inventory must be carried at the lower of cost or net realizable value. Once stock becomes unsellable, the loss hits earnings. Recent examples include Capri Holdings’ $1.18 billion loss in fiscal 2025 after writing down Versace and Michael Kors, and American Eagle’s $75 million spring/summer 2025 inventory write-down.
Regulatory and brand cost:
Destruction used to be the quiet exit, but that door is now closing. On 19 July 2026, the EU's Ecodesign for Sustainable Products Regulation (ESPR) bans the destruction of unsold apparel, footwear, and accessories for large companies, with medium-sized companies following in 2030. France's AGEC law has banned it since 2022.
Destruction now requires five years of documented justification, audited for safety or damage.
Environmental and ESG cost
Under CSRD, large fashion brands must now disclose Scope 3 emissions, including those embedded in unsold and destroyed stock. The 2024 EEA/ETC report puts EU textile destruction at 264,000 to 594,000 tonnes per year, generating roughly 5.6 million tonnes of CO₂ equivalent annually. That number now feeds investor-visible ESG scores and sustainability-linked loan terms.
Note: A $10 million deadstock pile is not just a $10 million problem. It can cost $3M–$4M per year to hold, then convert into a $6M–$8M write-down. Over its lifecycle, deadstock can cost 130–180% of the original inventory value. |
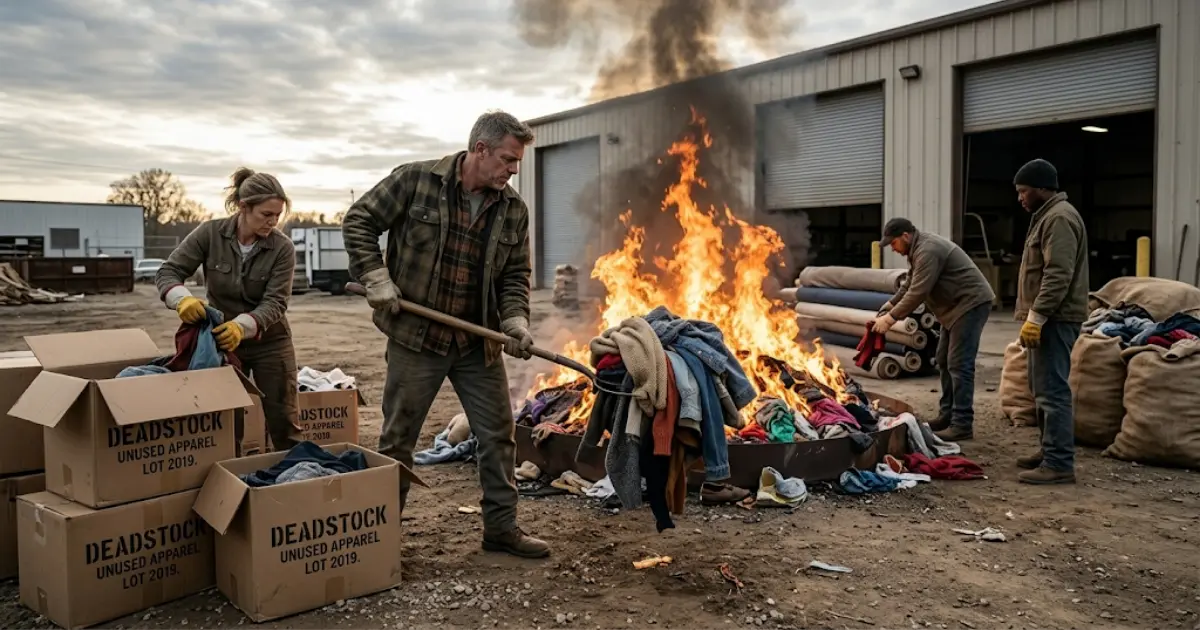
Destruction used to be the quiet exit.
9 Strategies to Prevent Deadstock
AI-Driven Demand Forecasting
Replace single-model forecasting with AI-driven multi-layer forecasting tools: statistical baselines for repeat basics, analog matching for new SKUs, external signals (weather, trend data, search interest) layered on top. Then feed the output straight into the buy plan rather than treating it as a reference document.
This method is suitable for new-product introductions, short-lifecycle SKUs, and any category where last year's sales curve isn't a reliable predictor.
Data-Driven Size and Color Curves
Build the size curve from actual store-level sell-through, not corporate assumption. Always recompute it every season. Do the same for color: don't allocate pastels evenly across a chain if pastels only sell in specific markets.
The move that matters here is at the allocation step. A good size curve at buy is wasted if you still ship equal packs to every store.
Store Clustering
Group stores by demand profile like climate, demographics, foot-traffic mix, and historical sales velocity, then allocate by cluster instead of by chain-wide averages. Three to five clusters is usually enough, more than that becomes difficult to plan and manage.
The result is a set of cluster-specific assortments and pack sizes, so each store group receives the products and sizes that actually sell in that market.
Pre-Orders and Drops
Shift production risk to the customer where the brand position allows it. This means taking orders first, then producing. Limited-edition drops work the same way by capping production before demand runs out of control.
However, the tradeoff is wait time. This practice only works well for streetwear, DTC brands, and products where scarcity supports the brand story. It is a poor fit for basics and always-on essentials.
Open-to-Buy Discipline
Set a hard OTB cap by class each season and enforce it. When buyers hit the cap, they must choose which styles deserve units, not simply shave every style slightly.
Pair this with a monthly OTB review that compares current sell-through against remaining budget, so the plan can adjust during the season instead of only at buy time.
Dynamic Reorder Points
Static reorder rules keep replenishing slow movers as long as sales trickle in. Replace them with rules that check projected weeks of supply, season position, and forward-looking velocity.
If projected weeks of supply crosses the threshold, cut the reorder regardless of the on-hand number.
Automated Markdown Triggers
Tie the first markdown to SKU aging, not the calendar. When an item enters the 61–90 day bucket without recovery, the system should propose or apply the first markdown automatically.
The value is speed. A markdown two weeks earlier can clear the same stock at a shallower discount.
Real-Time Cross-Channel Visibility
Use one inventory view across retail, ecommerce, wholesale, and marketplaces. When one channel is overstocked and another is short, the system should flag the mismatch and trigger a transfer or reallocation.
Much excess stock is not pure overbuying. It is stock sitting in the wrong place. Visibility does not fix the problem alone, but nothing fixes it without visibility first.
>> Explore: Top 7 Omni Channel Inventory Management Software Solutions
Agentic AI Inventory Management
Traditional systems show dashboards and wait for humans to act. Agentic systems monitor every SKU continuously and act within defined guardrails. They can trigger transfers, propose markdowns, cut the next PO, or reroute stock to the channel with stronger velocity as soon as a deadstock trajectory appears.
The real advantage is latency. Weekly dashboards create weekly decisions. Continuous agents create continuous decisions.
>> Read more: How Nūl Uses Agentic AI to Stop Overproduction?
What to Do When You Already Have Deadstock?
Once deadstock is on hand, the goal shifts from prevention to recovery. The question is not “how did this happen?” but which exit clears the most value, fastest, with the least brand damage. Below are common solutions:
Option | Cash Recovery | Brand Impact | Speed | Best For |
Hold at full price | 100% or 0% | None | Slowest | Timeless basics, near-launch SKUs |
Progressive markdown | Medium | Low | Medium | Seasonal styles with remaining demand |
Outlet channel | Medium | Low | Medium | Multi-season basics, outlet-safe categories |
Off-price B2B marketplace | Medium | Low | Fast | Ecommerce brands without owned outlets |
Wholesale liquidator | Low | Medium | Fast | Large volumes needing fast cash |
Bundle with best-sellers | Medium–high | None | Medium | Small volumes, accessories, add-ons |
Charitable donation | Tax value only | Positive | Fast | Older stock, ESG-led brands |
Upcycle or recycle line | Low–medium | Positive | Slow | Fabric-heavy stock, brands with design capacity |
Return to vendor | Contract-dependent | None | Medium | Supplier-backed inventory |
Destroy | Zero | Negative | Fast | Last resort; banned or restricted in key markets |
This matrix does not give exact recovery rates. Those depend on category, channel access, seasonality, and inventory condition. Its value is that it makes the tradeoffs visible.
Conclusion
Deadstock isn't the failure of one season's buy. It's the output of a system (forecasting, allocation, buying, replenishment, markdown timing, channel visibility) running slightly out of tune. Fix one stage and the number drifts sideways. Tune all of them and the number bends.
Looking for more? Dive into our other articles, updates, and strategies


Let's show you how
